Bitget App
Trade smarter

News
Stay up to date on the latest crypto trends with our expert, in-depth coverage.
1BTC Eyes $120K With Bullish H&S Pattern: Technical Analysis2Is Pudgy Penguins (PENGU) Poised for a Bullish Breakout? Key Fractal Pattern Saying Yes!3Fed Rate Cuts Incoming: Can Bitcoin Smash Through 120K?

Shocking AI Chip Smuggling Arrests: Unpacking the US-China Tech War and Nvidia’s Pivotal Stance
BitcoinWorld·2025/08/06 14:20

Pendle price forecast: PENDLE could reclaim $4.5 as adoption grows
Coinjournal·2025/08/06 14:20
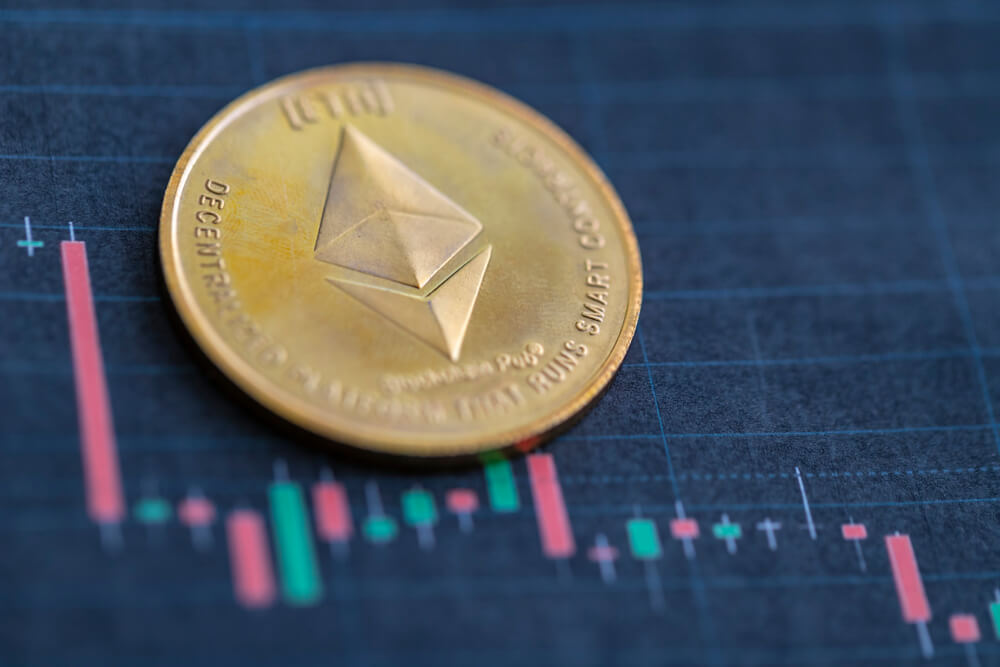
Ether could dip below $3,400 after retesting the $3,730 resistance; Check forecast
Coinjournal·2025/08/06 14:20

Solana Supply Shock Prompts Bullish Forecasts
Bitcoininfonews·2025/08/06 14:15
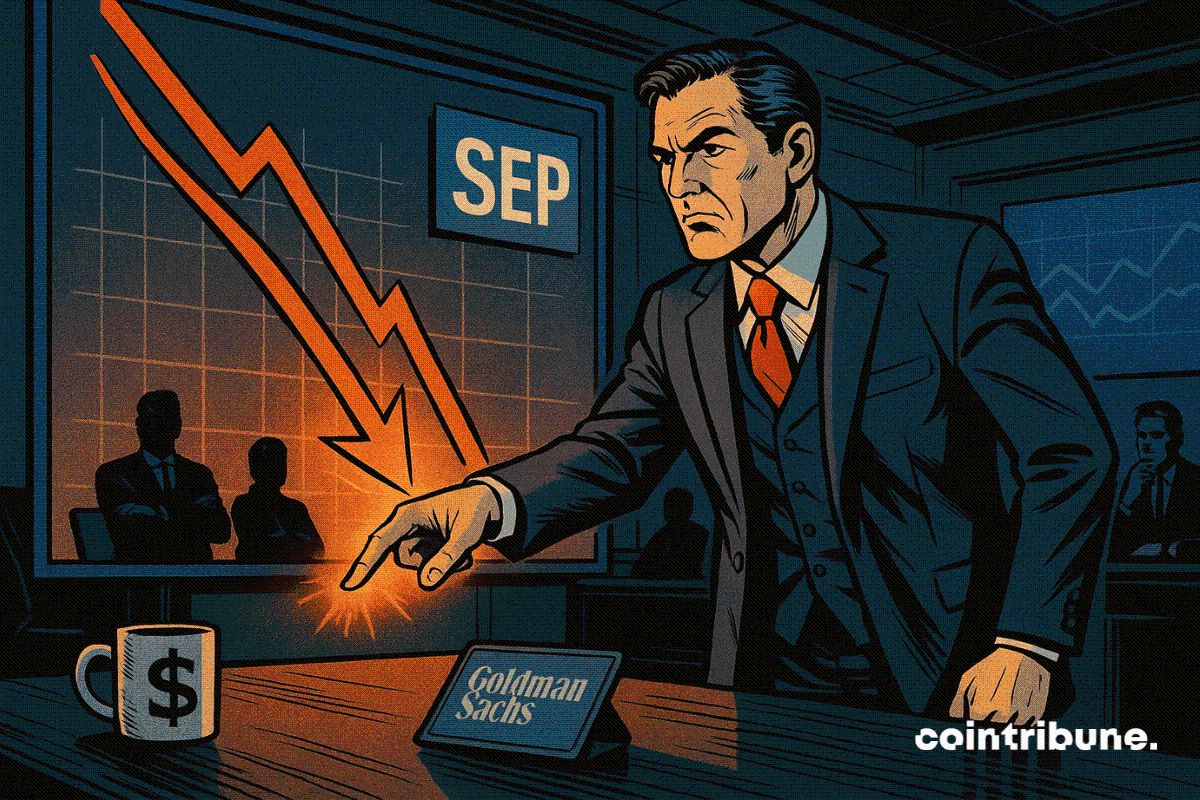
Goldman, Citigroup Predict 3 Rate Cuts By Year-end
Cointribune·2025/08/06 14:15
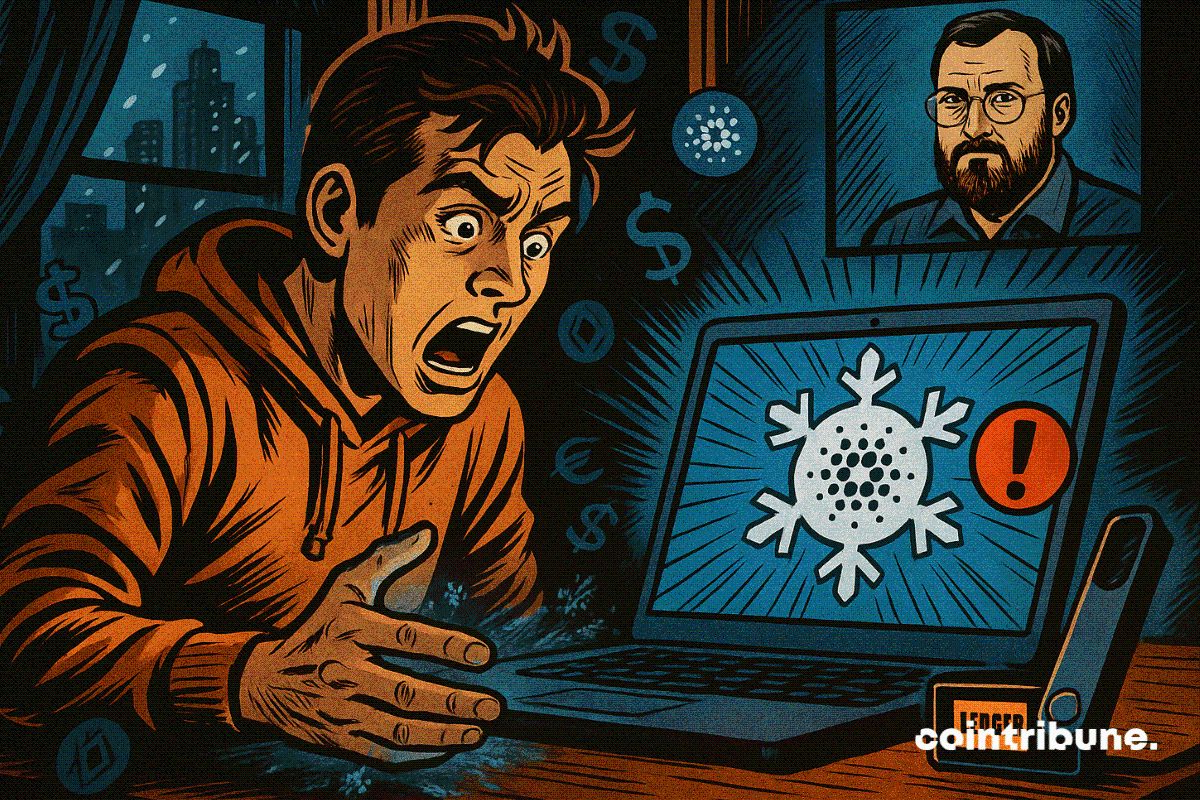
Charles Hoskinson Addresses Glacier Airdrop Issue Affecting Some Cardano Users
Cointribune·2025/08/06 14:15

Bitcoin (BTC) To Bounce Back? Key Macro Indicators Signaling Next Move Up
CoinsProbe·2025/08/06 14:15

VeChain (VET) To Bounce Back? Key Emerging Fractal Setup Saying Yes!
CoinsProbe·2025/08/06 14:15

Could Japan Get an XRP ETF Before the US?
SBI Holdings has sparked XRP ETF rumors, but the firm won't take action until Japan’s regulatory landscape is clearer. The product would likely be a basket, not a single XRP ETF.
BeInCrypto·2025/08/06 14:06

Bitget Hosts Crypto Experience Month 2025 Targeting Gen-Zs Across Europe, Asia and Middle East
Cryptoticker·2025/08/06 14:05
Flash
- 20:37If Bitcoin surpasses $114,000, the cumulative short liquidation intensity on major CEXs will reach $1.226 billions.According to ChainCatcher, if bitcoin breaks through $114,000, the cumulative short liquidation intensity on major CEXs will reach 1.226 billions. Conversely, if bitcoin falls below $110,000, the cumulative long liquidation intensity on major CEXs will reach 1.603 billions. Note: The liquidation chart does not display the exact number of contracts pending liquidation or the precise value of contracts being liquidated. The bars on the liquidation chart actually represent the relative importance, or intensity, of each liquidation cluster compared to adjacent clusters. Therefore, the liquidation chart shows the extent to which the underlying price reaching a certain level will be affected. A higher "liquidation bar" indicates that once the price reaches that level, there will be a stronger reaction due to a wave of liquidity.
- 20:33Bernstein: Circle's growth outlook remains robust, unfazed by Hyperliquid stablecoin competitionJinse Finance reported that Bernstein reiterated its $230 target price for Circle (CRCL), stating that USDC is expected to maintain its growth and will not be affected by the short-term impact of Hyperliquid stablecoins. Approximately 7.5% of USDC is used as collateral for Hyperliquid perpetual contracts, but Bernstein pointed out that it takes time to cultivate liquidity for new tokens. Circle CEO Jeremy Allaire stated that USDC will be deployed to HyperEVM. Analysts expect that the interest rate cut cycle and payment integration will drive demand for USDC, and its market share has now risen to 30%.
- 19:21The U.S. Senate Banking Committee will vote on the nomination of Milan as a Federal Reserve Board Governor on September 10.Jinse Finance reported that the U.S. Senate Banking Committee will vote on the nomination of Milan as a Federal Reserve Board member on September 10.