
BTC Eyes $120K With Bullish H&S Pattern: Technical Analysis

This is a daily analysis by CoinDesk analyst and Chartered Market Technician Omkar Godbole.
Bitcoin BTC$111,935.45 may not have rallied on Friday's dismal jobs data, which strengthened the Federal Reserve’s rate cuts, but all hope is not lost.
A shorter-duration chart reveals that BTC is forming a bullish inverse head-and-shoulders pattern – a classic reversal setup – suggesting a potential surge toward $120,000.
An inverse Head and Shoulders (H&S) is a bullish reversal pattern characterized by three troughs: a deeper central trough (the "head") flanked by two smaller but roughly equal troughs (the "shoulders"). The pattern includes a neckline, which is a horizontal trendline connecting the peaks of price recoveries between the troughs.
A decisive breakout above this neckline confirms the reversal from a downtrend to an uptrend. The resulting rally is typically expected to be approximately equal in height to the distance between the deepest trough (head) and the neckline.
As of writing, BTC looked to be forming the right shoulder of the inverted H&S pattern, with the neckline resistance at $113,378. A move above that would trigger the bullish breakout, opening the door for a rally to nearly $120,000.
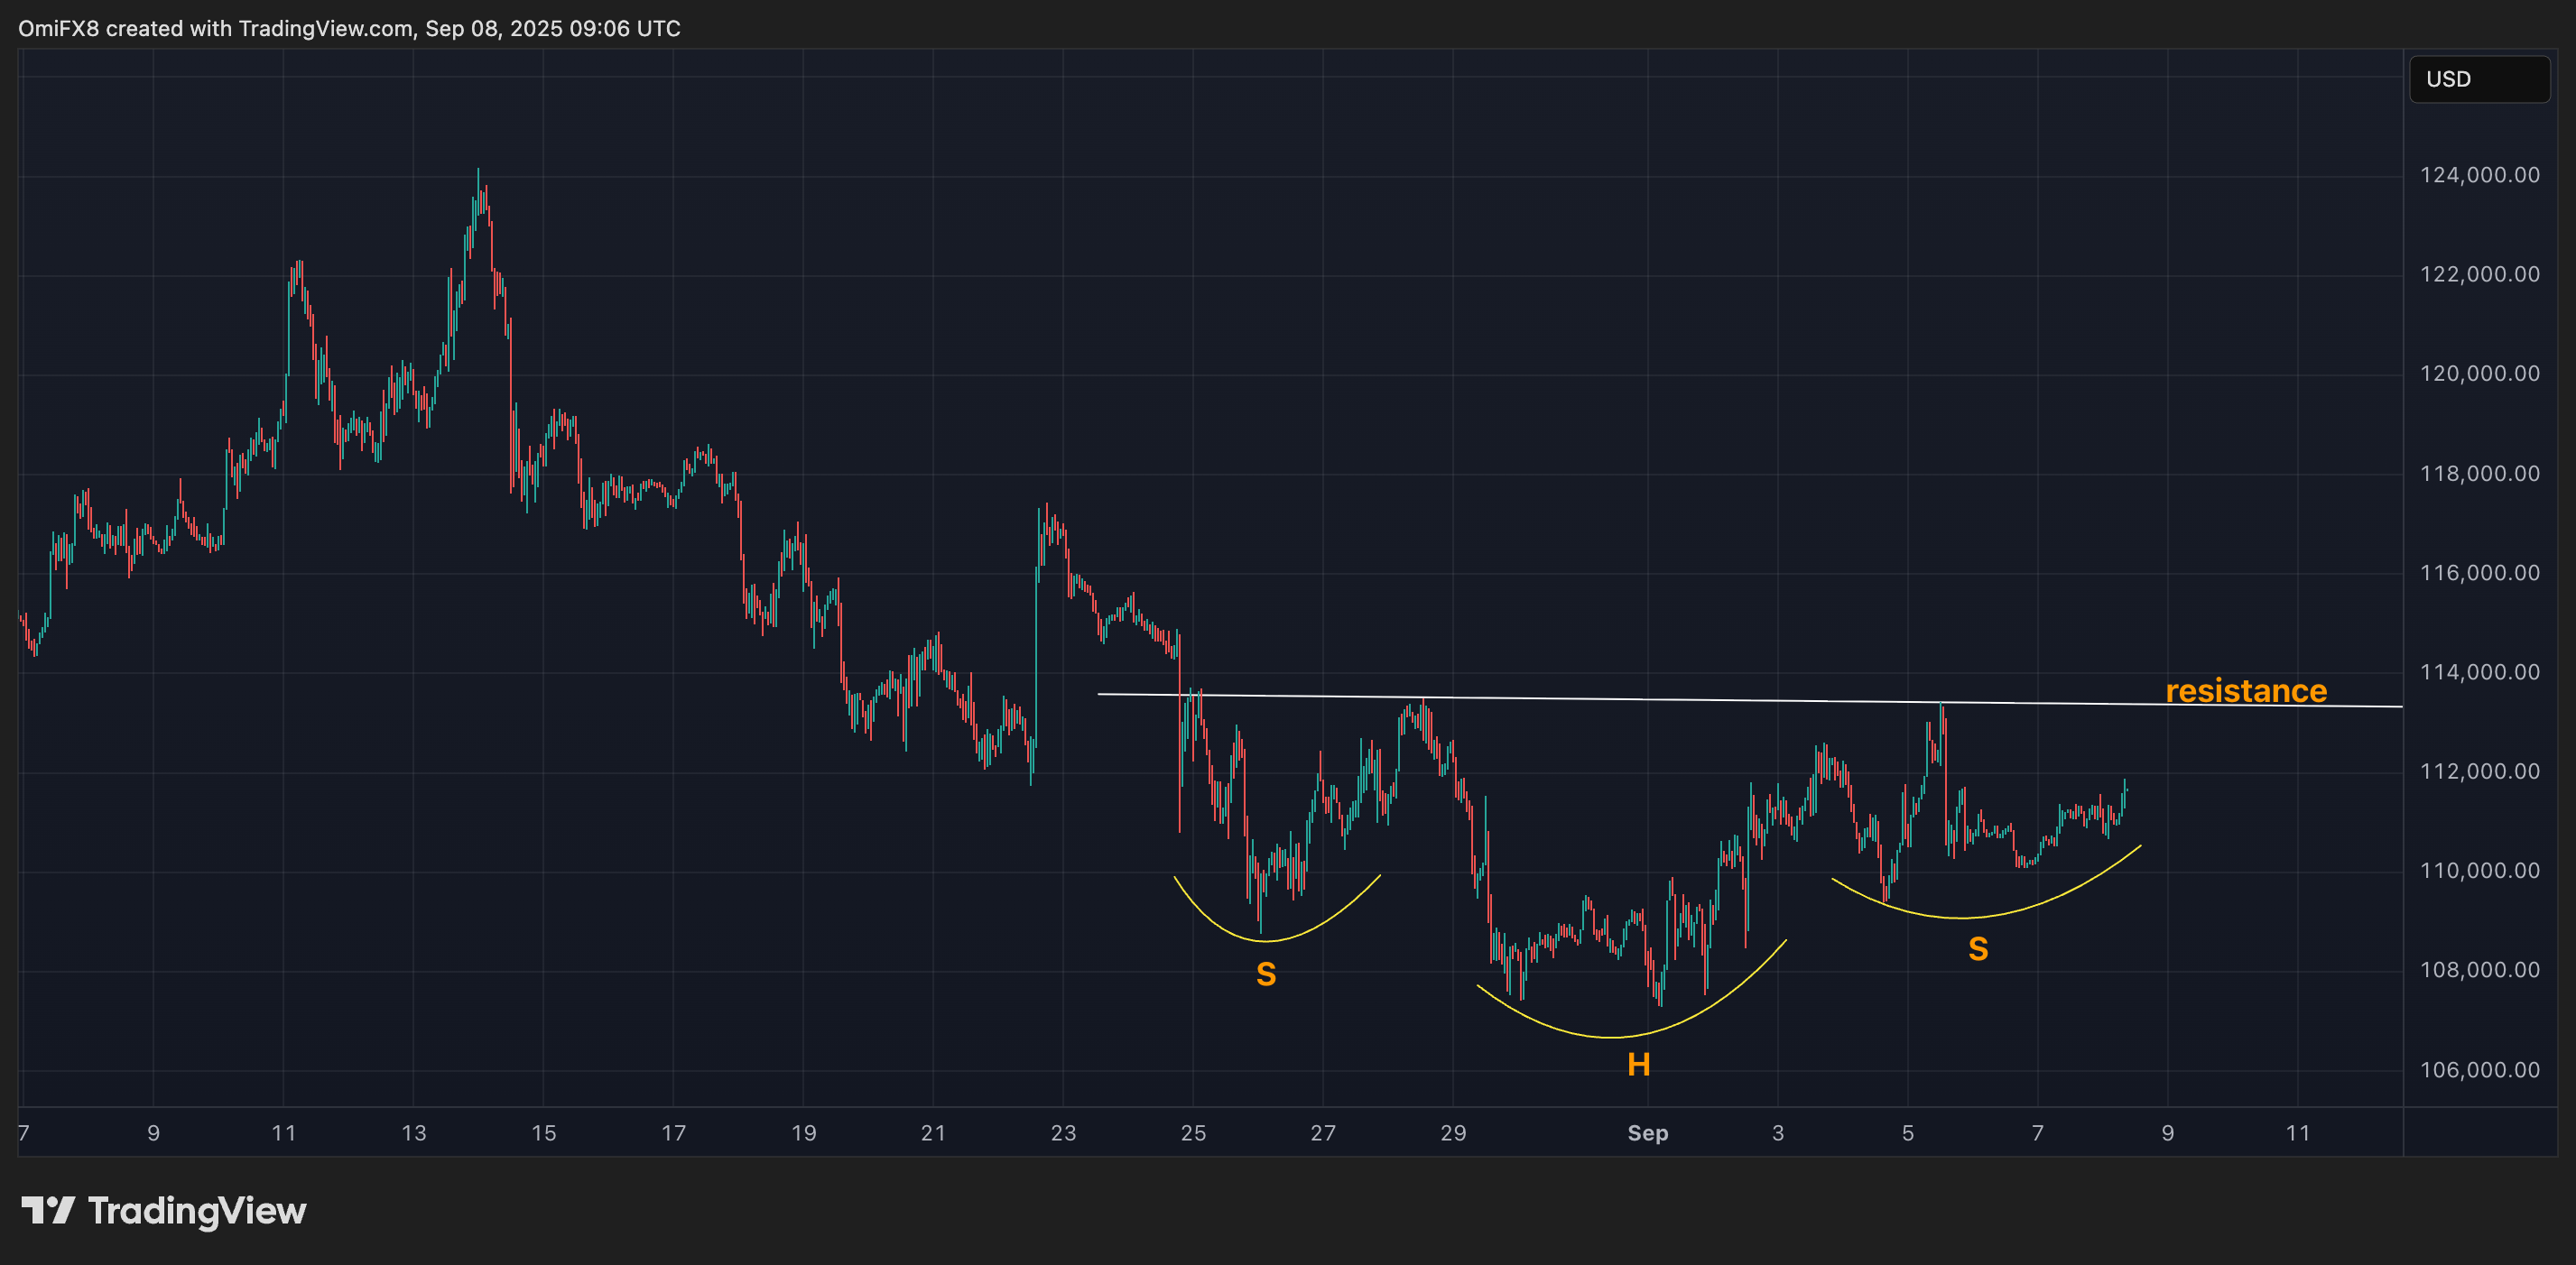
The pattern would be invalidated in case of a move below $107,300, reinforcing the bearish setup on the daily chart. In that case, the focus would shift to the 200-day simple moving average support near $101,850.
Read: Bitcoin Stays Below $112K After Tough Jobs Report and Fed Cut Bets.
Disclaimer: The content of this article solely reflects the author's opinion and does not represent the platform in any capacity. This article is not intended to serve as a reference for making investment decisions.
You may also like
Crypto: Fundraising Explodes by +150% in One Year
Bitcoin Drops $8B In Open Interest : Capitulation Phase ?
Coinpedia Digest: This Week’s Crypto News Highlights | 29th November, 2025
QNT Price Breaks Falling Wedge: Can the Bullish Structure Push Toward $150?
