Bitget App
Giao dịch thông minh hơn
Mua CryptoThị trườngGiao dịchFutures‌EarnWeb3Quảng trườngThêm
Giao dịch
Spot
Mua bán tiền điện tử
Ký quỹ
Gia tăng vốn và tối ưu hiệu quả đầu tư
Onchain
Going Onchain, without going Onchain!
Convert
Miễn phí giao dịch và không trượt giá.
Khám phá
Launchhub
Giành lợi thế sớm và bắt đầu kiếm lợi nhuận
Sao chép
Sao chép elite trader chỉ với một nhấp
Bots
Bot giao dịch AI đơn giản, nhanh chóng và đáng tin cậy
Giao dịch
USDT-M Futures
Futures thanh toán bằng USDT
USDC-M Futures
Futures thanh toán bằng USDC
Coin-M Futures
Futures thanh toán bằng tiền điện tử
Khám phá
Hướng dẫn futures
Hành trình giao dịch futures từ người mới đến chuyên gia
Chương trình ưu đãi futures
Vô vàn phần thưởng đang chờ đón
Bitget Earn
Sản phẩm kiếm tiền dễ dàng
Simple Earn
Nạp và rút tiền bất cứ lúc nào để kiếm lợi nhuận linh hoạt không rủi ro
On-chain Earn
Kiếm lợi nhuận mỗi ngày và được đảm bảo vốn
Structured Earn
Đổi mới tài chính mạnh mẽ để vượt qua biến động thị trường
Quản lý Tài sản và VIP
Dịch vụ cao cấp cho quản lý tài sản thông minh
Vay
Vay linh hoạt với mức độ an toàn vốn cao
Giá MidasProtocol

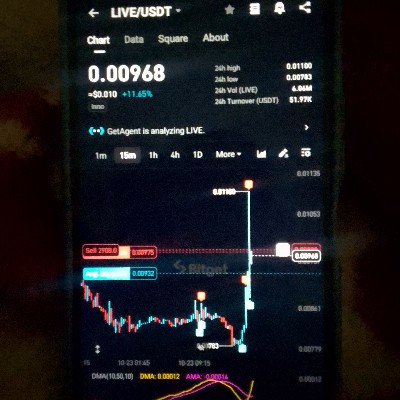
Giá MidasProtocolMAS

Giá MidasProtocol (MAS) tính theo Việt Nam Đồng là -- VND tính đến 15:43 (UTC) hôm nay.
Giá của coin này chưa được cập nhật hoặc đã ngừng cập nhật. Thông tin trên trang này chỉ mang tính chất tham khảo. Bạn có thể xem các coin đã niêm yết trên Thị trường spot Bitget.
Đăng ký

Thông tin thị trường MidasProtocol

Hiệu suất giá (24 giờ)
24 giờ
Mức thấp nhất trong 24 giờ là ₫6.25Mức cao nhất trong 24 giờ là ₫6.25
Thứ hạng thị trường:
--
Vốn hóa thị trường:
--
Vốn hóa thị trường pha loãng hoàn toàn:
--
Khối lượng (24h):
--
Nguồn cung lưu hành:
195.54M MAS
Nguồn cung tối đa:
--
Tổng nguồn cung:
500.00M MAS
Tỷ lệ lưu hành:
39%
Hợp đồng:
0x23cc...f832430(Ethereum)
Link:
Mua/bán MidasProtocol ngay

Giá MidasProtocol trực tiếp tính bằng VND hôm nay

Giá MidasProtocol trực tiếp hôm nay là ₫0.00 VND với vốn hóa thị trường hiện tại là ₫0.00. Giá MidasProtocol tăng 0.00% trong 24 giờ qua và khối lượng giao dịch trong 24 giờ là ₫0.00. Tỷ lệ chuyển đổi MAS/VND (MidasProtocol sang VND) được cập nhật theo thời gian thực.
1 MidasProtocol trị giá bao nhiêu Việt Nam Đồng?
Tính đến thời điểm hiện tại, giá MidasProtocol (MAS) tính theo Việt Nam Đồng là ₫0.00 VND. Bạn hiện có thể mua 1 MAS với giá ₫0.00, hoặc mua 0 MAS với ₫10. Trong 24 giờ qua, giá MAS tính theo VND cao nhất là ₫6.25 VND và giá MAS tính theo VND thấp nhất là ₫6.25 VND.
Thông tin sau được bao gồm:Dự đoán giá MidasProtocol, giới thiệu dự án MidasProtocol, lịch sử phát triển và nhiều hơn nữa. Tiếp tục đọc để hiểu rõ hơn về MidasProtocol.

Bitget Insights

commatozee
commatozee
9giờ
$BOOST/USDT — Channel + Wedge, patience at the supports before a confirmed
I’m watching $BOOST on Bitget — this chart is a textbook “buy the base or buy the breakout” situation. Price has been compressing inside a rising micro-channel that followed a broader down / reclaim phase; volume spikes show liquidity hunts and distribution, and the clean edge is either a demand-catch at the green support band or a volume-backed breakout above the red resistance shelf. Trade smaller into structure, then scale only after confirmation. Market snapshot Live price (reference feeds show mid-$0.10s → $0.11 range). Market context: micro-cap token with circulating supply in the low hundreds of millions and an FDV in the low-tens of millions (check live pages before sizing). Chart read: recent close ≈ 0.105–0.110; immediate red resistance cluster ≈ 0.121–0.122 (primary breakout target), immediate support band ≈ 0.089–0.095, major support floor ≈ 0.075–0.079 (deep demand shelf). Volume spikes are visible on the annotated pushes; MACD is near zero with a flattening histogram (early momentum base forming). Structure & context — why this matters Price moved from a distribution impulse into a controlled reclaim. After the reclaim it settled into a rising micro-channel / bullish wedge above a clear green demand band. That demand band has absorbed multiple tests and produced shallow rejection wicks rather than decisive breakdowns — this creates an asymmetric risk-reward: a structured demand catch has high R:R if rejection volume appears; conversely, a volume-backed breakout above the red shelf opens a short, fast run to the 0.12 area. The chart’s primary decision axis is: support defend (catch) vs resistance reclaim (breakout). Momentum & tape (what to watch) Volume: prior rallies were accompanied by distinct spikes — those were the liquidity clears. Current baseline is lower; any break or retest must show a clear pickup in tape (2×–3× local baseline) to validate direction. MACD / histogram: lines sit near zero and the histogram is flattening — this is a neutral-to-primed state (not yet trending). A widening positive histogram on breakout is required to trust continuation. MA ribbon / VWAP: short MAs are clustered near price — use them as micro-timing levels for entries/exits. VWAP acceptance on a breakout strengthens the institutional case. Orderflow risk: the annotated chart shows concentrated supply in the red band above 0.12 — expect stop runs and wick tests into that shelf even on initial breakouts. Key levels (actionable) Immediate resistance / breakout trigger: 0.1210–0.1222 (trim / re-assess at / into this zone). Mid reaction zone: ~0.100–0.112 (where first profit-taking often appears). Safe re-entry / demand band: 0.089–0.095 (use laddered limits across the band). Structural invalidation / deep test: decisive hourly close below 0.075–0.079 flips the bias toward deeper distribution. Targets on clean breakout: T1 = 0.121, T2 = 0.145–0.16 (if tape and market sentiment align), scale heavily at T1. Trade plans (three paths — pick by risk tolerance) A) Demand-catch (patient, best R:R) Condition: price prints a clean rejection wick + sharp buy spike inside 0.089–0.095 with volume > local baseline. Entry: ladder limit orders across the band (e.g., 50% near 0.095, 50% near 0.090). Stop: just below the band — set structural invalidation around 0.075 (or use 1.5× ATR if you prefer volatility sizing). Targets: T1 0.112 (trim 30–40%), T2 0.121 (trim further), T3 extend if momentum holds. B) Momentum add (aggressive) Condition: hourly close above 0.121 with volume spike (≥2× baseline) and expanding MACD histogram. Entry: ladder on retest of breakout (0.118–0.122). Stop: below retest wick (~0.112). Targets: 0.145 → 0.16 (trim in stages). C) Defensive / Short (structure fail) Condition: hourly close below 0.089 with accelerating sell volume. Action: reduce long exposure; consider short with strict stops in thin orderbook environments. Targets: 0.079 → 0.075; stop above local resistance (~0.095). Sizing, risk math & execution rules Use ATR-aware stops. Expect wider wicks on thin listings — start small. Example: $10k account, 1% risk ($100). If entry at 0.095 and stop at 0.075 → stop distance 0.020 → position = $100 / 0.020 = 5,000 BOOST (approx). Adjust for fees & slippage. Always ladder: 50% starter, 50% add on confirmation. Use OCO orders where possible. On-chain / fundamental checks (must pass before scaling) Confirm circulating supply and any upcoming unlocks or vesting that could introduce sell pressure. . Watch exchange inflows and large wallet transfers — big deposits typically precede dump events. Check for listing/campaign announcements . Liquidity & execution caveats This is a micro-cap environment: orderbook depth will amplify slippage on larger sizes. If expected slippage ruins R:R, reduce position or wait for clearer liquidity. Stop-hunts into the green band are possible; avoid full-sizing into the first touch — ladder instead. Psychology + what to expect Expect fast moves when both sides are impatient. If buyers show conviction (volume + MACD expansion), the breakout leg will be sharp and require fast partial trims. If sellers dominate, price will chop and test the major support. Discipline beats FOMO — follow the checklist. TL;DR / Final byte $BOOST sits at a classical decision point: defend the 0.089–0.095 demand band for a high-R:R demand catch, or wait for a volume-backed reclaim above 0.121 to ride the breakout. Use ATR-based stops, ladder your entries, trim into spikes, and verify on-chain/exchange flows before scaling. Live price and tokenomics data (market cap; circulating supply) are available on mainstream trackers — cross-check those pages before committing.
MAS-2.24%
BOOST-14.26%
CryptoSorcerer
CryptoSorcerer
1ngày
$ETH possible short-term and medium-term trading decisions: Chart Analysis (15m)
$ETH --- Current Price: $4,445 24h High / Low: $4,464 / $4,298 → Strong intraday volatility (~3.8%). Moving Averages: MA(5): $4,437 → Above short-term support. MA(10): $4,431 → Price holding above. MA(20): $4,428 → Trend still bullish as price trades above all MAs. 👉 All MAs are close and sloping upward → bullish momentum in the short term. Volume: 11.61K in the last bar (increasing on recent breakout toward $4,464). Higher volume on green candles → buyers in control. Structure: Support: $4,428 → $4,431 (cluster of MAs) and $4,298 (recent swing low). Resistance: $4,464 (today’s high). If ETH breaks $4,464 with strong volume, next upside target: $4,500 → $4,520. --- 📊 Trading Outlook Bullish Case (Likely if BTC also strong) Entry: Wait for breakout above $4,465 with volume confirmation. Target: $4,500 → $4,520 (short-term scalp). Stop-loss: $4,430 (below 20-MA). Bearish Case (If rejection at $4,464) Entry: If ETH fails to break and closes below $4,430. Target: $4,400 → $4,370. Stop-loss: $4,465 (just above resistance). --- ⚠️ Risk Management ETH moves fast → avoid high leverage unless scalp trading. Risk/reward ratio: Keep at least 1:2. Use stop-losses since intraday volatility can wipe positions quickly. --- 📌 Bigger Picture News: "Ethereum ETF Sees $44M Inflow in One Day" → bullish institutional signal. If ETF inflows continue, ETH could push above $4,500 in the coming days. But watch BTC — ETH usually follows Bitcoin’s trend. --- ✅ Suggestion: Short-term traders → play breakout above $4,465 or rejection short near $4,464. Swing traders → watch daily close; if ETH closes above $4,500, next leg could be toward $4,650–4,700.
BTC-0.32%
ETH+1.82%
mehr_123
mehr_123
1ngày
Technical Analysis: TRADOORUSDT
Intro: Hey folks, as a crypto analyst with three years under my belt digging into charts and market moves, I'm diving into TRADOORUSDT today TRADOOR, has been showing some wild volatility lately—perfect for those who love a good swing trade but nerve-wracking for the faint-hearted. The current price sits at around 2.0897 USDT, up about 2.2% in the session, with volume clocking in at 15.27K. That's not massive, but it's enough to signal some interest building. Price action Let's break down the price action. Starting from the left side of the chart (around September 5), we see a sharp plunge that bottomed out, followed by a monster green candle that rocketed the price up—looks like a classic capitulation followed by a relief rally. After that spike, things consolidated with a series of smaller red and green candles, trending slightly downward before hooking back up toward the end. The overall pattern screams of a potential bottoming formation, maybe an inverted head and shoulders if you squint, but it's early days. Volume tells a story too: it spiked massively on that big green bar (likely the reversal point), then tapered off during the consolidation, suggesting buyers stepped in hard but are now waiting for confirmation. we've got the 9-period SMA at 2.1565 and DEMA at 2.1415. Price is trading just below both, which hints at short-term bearish pressure—think of it as the token catching its breath after a sprint. If we close above these moving averages, it could flip bullish quickly. we're coming out of oversold territory after that low support and resistance level Immediate support kicks in around 1.80-1.90, where the price bounced multiple times during the consolidation phase; it's a psychological floor with prior wicks testing it. Deeper down, 1.21 looks like a major demand zone, as it's where the volume bar exploded on the upside reversal—buyers defended it aggressively. If we crack that, 1.121 (the absolute low) is the panic button, a level where demand could surge back in, but it'd signal serious weakness. On the upside, resistance starts at 2.3-2.45,right where those moving averages sit and where recent highs capped the rally. Breaking that opens the door to 2.35, a prior peak with red candle rejection. Beyond, 2.48 feels like the big boss level—it's where the chart tops out visually, and clearing it could spark FOMO buying toward 3.00 if momentum builds. Watch for a golden cross if shorter MAs cross above longer ones; that'd be my buy signal. Overall sentiment? Bullish bias if we hold above 1.90, but crypto's unpredictable—news on Tradoor platform adoption could juice it. Risk management is key: set stops below supports, and don't go all-in. Volume needs to pick up for sustainability. If you're trading this, keep an eye on broader market vibes; Bitcoin's moves often drag alts like this along. Let's see if TRADOOR can break out or if it's just another pump-and-dump tease. What do you think—long or short? $TRADOOR Market Context and Outlook Diving a bit deeper into TRADOOR's ecosystem, this token powers a user-friendly platform for leveraged trading right in Telegram, which is genius for onboarding newbies without the hassle of full wallets. With recent listings and a focus on zero-slippage trades, it's gaining traction amid the 2025 bull whispers. But volatility is real—24-hour volumes hit $90M+, per recent data, showing liquidity but also whale influence. Fundamentally, if adoption grows (think more users on perps), we could see sustained upside. Short-term, watch for a retest of 2.00; holding there sets up for 2.50 targets. Risks include regulatory hiccups on Telegram bots or broader crypto downturns. I'd allocate 5-10% portfolio here if bullish, with tight stops. Optimistic for Q4 if integrations roll out.
HOLD-1.38%
MAS-2.24%
BGUSER-1A2BDSY9
BGUSER-1A2BDSY9
2ngày
BOOST/USDT: A Technical Snapshot of Controlled Volatility.. A glance at the BOOST/USDT chart reveals an asset in a fascinating state of consolidation after a significant pump. Trading at approximately $0.1015, the +5.73% surge is impressive, but the real story is told beneath the surface, in the convergence of key technical indicators and the market mechanics at play. The most compelling insight lies in the relationship between the Moving Averages (MAs) and the Bollinger Bands. Notice how the current price ($0.101508) is trading almost perfectly at the 5-period MA (0.101416) and is nestled tightly between the Bollinger Band's middle line (0.101286) and its upper band (0.102206). This positioning, combined with a notably narrow bandwidth between the Upper and Lower Bands, signals a period of extremely low volatility. The market is coiling, and such compression often precedes a significant expansion—a sharp price move in either direction. Traders are effectively waiting for a catalyst to break this equilibrium. This catalyst might already be present. The prominent promotion, "CandyBomb x BOOST: Deposit or Trade to share 8...," is not merely marketing fluff; it's a fundamental market driver. Such events create artificial buying pressure as users deposit and trade to qualify for rewards. This likely contributed to the healthy 24-hour volume of 4.28M USDT and helped establish a strong support level near the 24h low of $0.072. The key question is whether this promotional momentum is sustainable or if it has created a temporary price floor that could be tested once the event concludes. Furthermore, the alignment of the Exponential Moving Averages (EMAs) is telling. The EMA(5) at 0.101489, EMA(10) at 0.101462, and EMA(20) at 0.101370 are virtually flatlined on top of each other. This convergence is a classic indicator of a market lacking a strong trend and in a state of indecision. However, the fact that the price is hovering just above all three near-term EMAs suggests a slight bullish lean within this consolidation phase. The Parabolic SAR (0.102173) sitting above the current price provides a clear and immediate resistance level. For a convincing bullish breakout to occur, sustained buying volume is needed to push the price above this SAR level and, more importantly, breach the Bollinger Upper Band. Failure to do so could see the price revert towards the lower band and test the $0.10 psychological support level. In summary, BOOST is at a technical crossroads. The promotional activity has provided stability and volume, leading to a tight consolidation pattern. The convergence of MAs and the squeezing Bollinger Bands indicate that this period of calm is unlikely to last. Traders should watch for a volume-backed break above the SAR and the Upper Band for a confirmation of the next leg up, or a break below the key EMAs for a retracement towards the $0.10 handle. The market is coiled; the next major move is being primed. $BOOST
MOVE+0.21%
MAS-2.24%

Nguồn thông tin về MAS

Xếp hạng MidasProtocol
4.4
Xếp hạng 100
Hợp đồng:
0x23cc...f832430(Ethereum)
Link:

Bạn có thể làm gì với các loại tiền điện tử như MidasProtocol (MAS)?

Nạp dễ dàng và rút nhanh chóngMua để tăng trưởng, bán để thu lợi nhuậnGiao dịch spot để kiếm chênh lệch giáGiao dịch futures với rủi ro cao và lợi nhuận caoKiếm thu nhập thụ động với lãi suất ổn địnhChuyển tài sản với ví Web3 của bạn

Làm thế nào để tôi có thể mua được tiền điện tử?

Tìm hiểu cách nhận tiền điện tử đầu tiên của bạn trong vài phút.
Xem hướng dẫn

Làm thế nào để tôi có thể bán được tiền điện tử?

Tìm hiểu cách rút tiền điện tử của bạn trong vài phút.
Xem hướng dẫn

MidasProtocol là gì và MidasProtocol hoạt động như thế nào?

MidasProtocol là một loại tiền điện tử phổ biến. Là một loại tiền tệ phi tập trung ngang hàng, bất kỳ ai cũng có thể lưu trữ, gửi và nhận MidasProtocol mà không cần cơ quan tập trung như ngân hàng, tổ chức tài chính hoặc các bên trung gian khác.
Xem thêm

Mua thêm

Câu Hỏi Thường Gặp

Giá hiện tại của MidasProtocol là bao nhiêu?

Giá trực tiếp của MidasProtocol là ₫0 cho mỗi (MAS/VND) với vốn hóa thị trường hiện tại là ₫0 VND. Giá trị của MidasProtocol trải qua những biến động thường xuyên do hoạt động liên tục 24/7 trên thị trường tiền điện tử. Giá hiện tại của MidasProtocol trong thời gian thực và dữ liệu lịch sử khả dụng trên Bitget.

Khối lượng giao dịch 24 giờ của MidasProtocol là bao nhiêu?

Trong 24 giờ qua, khối lượng giao dịch của MidasProtocol là ₫0.00.

Giá cao nhất mọi thời đại của MidasProtocol là bao nhiêu?

Giá cao nhất mọi thời đại của MidasProtocol là ₫14.15M. Mức giá cao nhất mọi thời đại này là mức giá cao nhất của MidasProtocol kể từ khi ra mắt.

Liệu tôi có thể mua MidasProtocol trên Bitget?

Có, MidasProtocol hiện đang khả dụng trên sàn giao dịch tập trung của Bitget. Để biết thêm chi tiết, vui lòng xem qua hướng dẫn Hướng dẫn mua midasprotocol của chúng tôi.

Tôi có thể nhận được thu nhập ổn định khi đầu tư vào MidasProtocol không?

Như mọi người đều biết, Bitget cung cấp nền tảng giao dịch chiến lược, với các bot giao dịch thông minh để tự động hóa các giao dịch của bạn và kiếm lợi nhuận.

Tôi có thể mua MidasProtocol ở đâu với mức phí thấp nhất?

Chúng tôi vui mừng thông báo nền tảng giao dịch chiến lược hiện đã có mặt trên sàn giao dịch Bitget. Bitget cung cấp mức phí giao dịch và độ sâu tốt hàng đầu trong ngành để đảm bảo lợi nhuận cho các khoản đầu tư của nhà giao dịch.

Các ưu đãi hấp dẫn

Tôi có thể mua MidasProtocol (MAS) ở đâu?

Mua tiền điện tử trên ứng dụng Bitget
Đăng ký trong vòng vài phút để mua tiền điện tử bằng thẻ tín dụng hoặc chuyển khoản ngân hàng.
Download Bitget APP on Google PlayDownload Bitget APP on AppStore
Giao dịch trên Bitget
Nạp tiền điện tử của bạn vào Bitget, tận hưởng thanh khoản cao và phí giao dịch thấp.

Mục video — xác minh nhanh, giao dịch nhanh

play cover
Cách hoàn tất xác minh danh tính trên Bitget và bảo vệ bạn khỏi gian lận
1. Đăng nhập vào tài khoản Bitget của bạn.
2. Nếu bạn chưa quen với Bitget, hãy xem hướng dẫn của chúng tôi về cách tạo tài khoản.
3. Di chuột qua biểu tượng hồ sơ của bạn, nhấp vào "Chưa xác minh" và nhấn "Xác minh".
4. Chọn quốc gia hoặc khu vực phát hành và loại ID của bạn, sau đó làm theo hướng dẫn.
5. Chọn "Xác minh Di động" hoặc "PC" dựa trên sở thích của bạn.
6. Nhập thông tin chi tiết của bạn, gửi bản sao giấy tờ tùy thân và ảnh selfie.
7. Gửi đăng ký của bạn và chúc mừng, bạn đã hoàn tất xác minh danh tính!
Mua MidasProtocol với 1 VND
Gói quà chào mừng trị giá 6200 USDT dành cho người dùng Bitget mới!
Mua MidasProtocol ngay
Đầu tư tiền điện tử, bao gồm mua MidasProtocol trực tuyến qua Bitget, có thể chịu rủi ro thị trường. Bitget cung cấp các phương thức đơn giản và thuận tiện để bạn mua MidasProtocol, bên cạnh đó, chúng tôi cố gắng đưa thông tin đầy đủ đến người dùng của mình về từng loại tiền điện tử được cung cấp trên nền tảng. Tuy nhiên, chúng tôi sẽ không chịu trách nhiệm về các kết quả có thể phát sinh từ giao dịch mua MidasProtocol của bạn. Trang này và các thông tin trong đó không được xem là chứng thực của bất kỳ loại tiền điện tử cụ thể nào.