Boring Bitcoin's Green Light Moment Incoming?

This is a technical analysis post by CoinDesk analyst and Chartered Market Technician Omkar Godbole.
The Fed has come and gone without moving the needle on bitcoin's BTC$92,534.21 price in any meaningful way. The central bank cut rates by 25 basis points as expected, but supposedly delivered hawkish forward guidance. Still, the dollar has been sold off.
Amid all this, BTC continues to bore traders with its directionless price action.
The picture on the daily price chart remains largely unchanged since before the Fed, with prices still stuck in that countertrend mini-rising channel within the bigger downtrend.
Any seasoned technical trader would tell you the playbook is simple now. If we break above the bearish trendline, it signals that the downtrend from the record high has ended. On the flip side, if we dive below the mini ascending channel, it reinforces the broader downtrend, potentially leading to deeper losses.
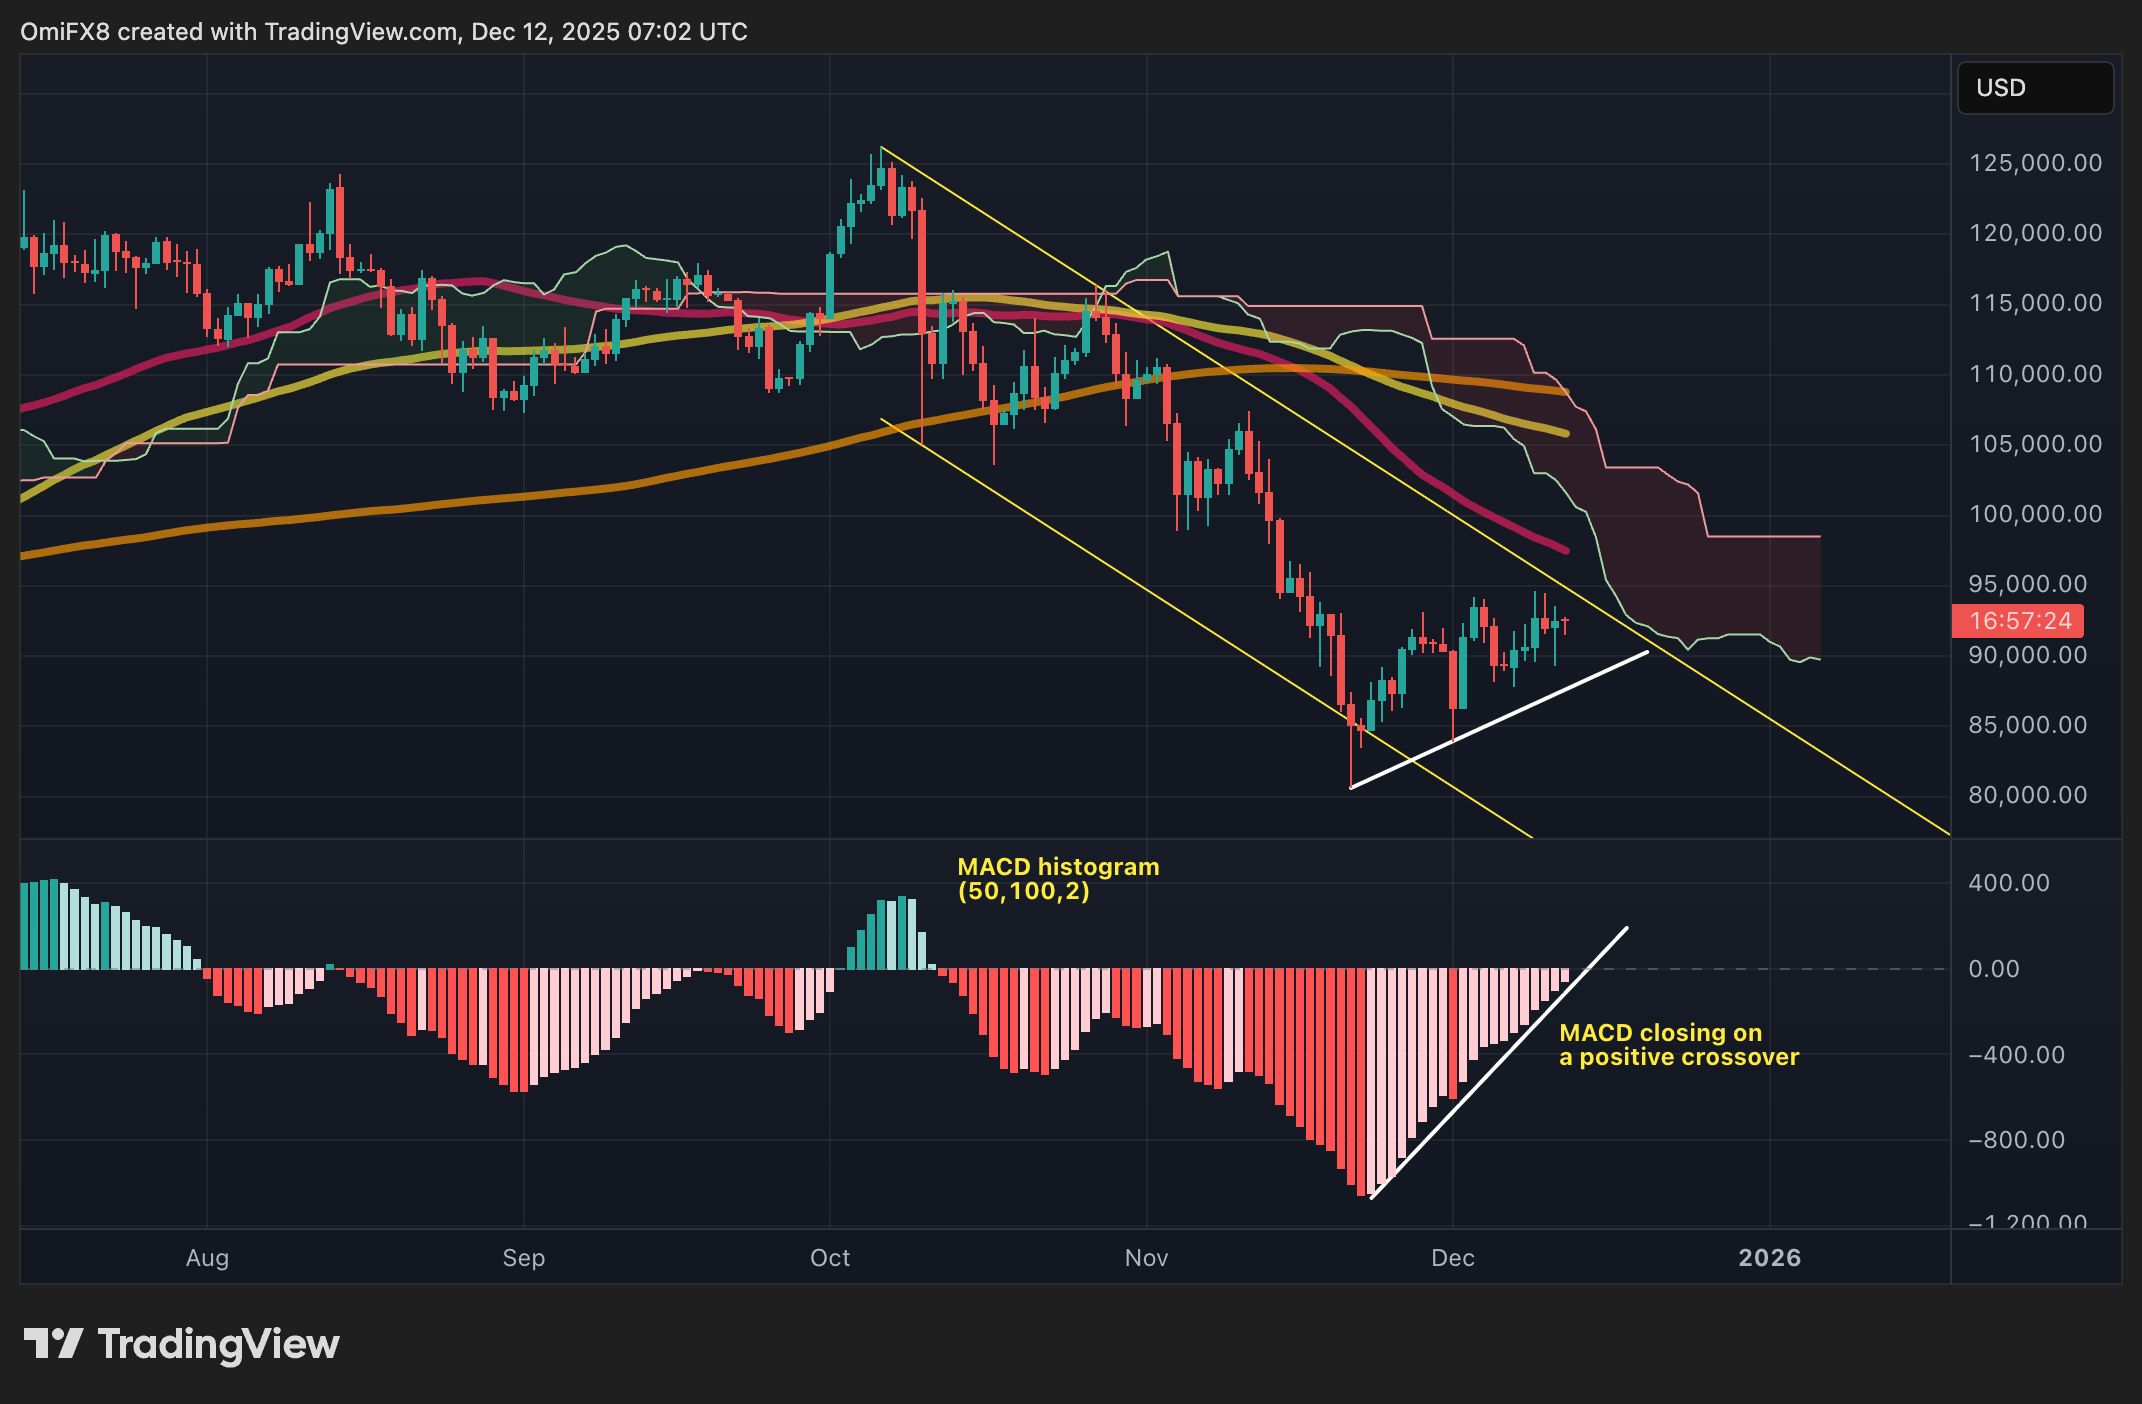
Which way will it go? As of writing, the bull case looks appealing, as the MACD histogram, with parameters set to (50,100,9) to gauge the medium-to-long term, is on the verge of crossing above zero (flashing green signal). Positive MACD crossovers indicate a renewed bullish momentum.
The dollar index, one of BTC's top nemesis, has taken a hit since the Fed meeting, undermining the central bank's supposedly hawkish tone. The DXY fell to 98.13 on Thursday, the lowest since Oct. 17 and was last seen at 98.36. A weaker dollar tends to bode well for risk assets, including cryptocurrencies.
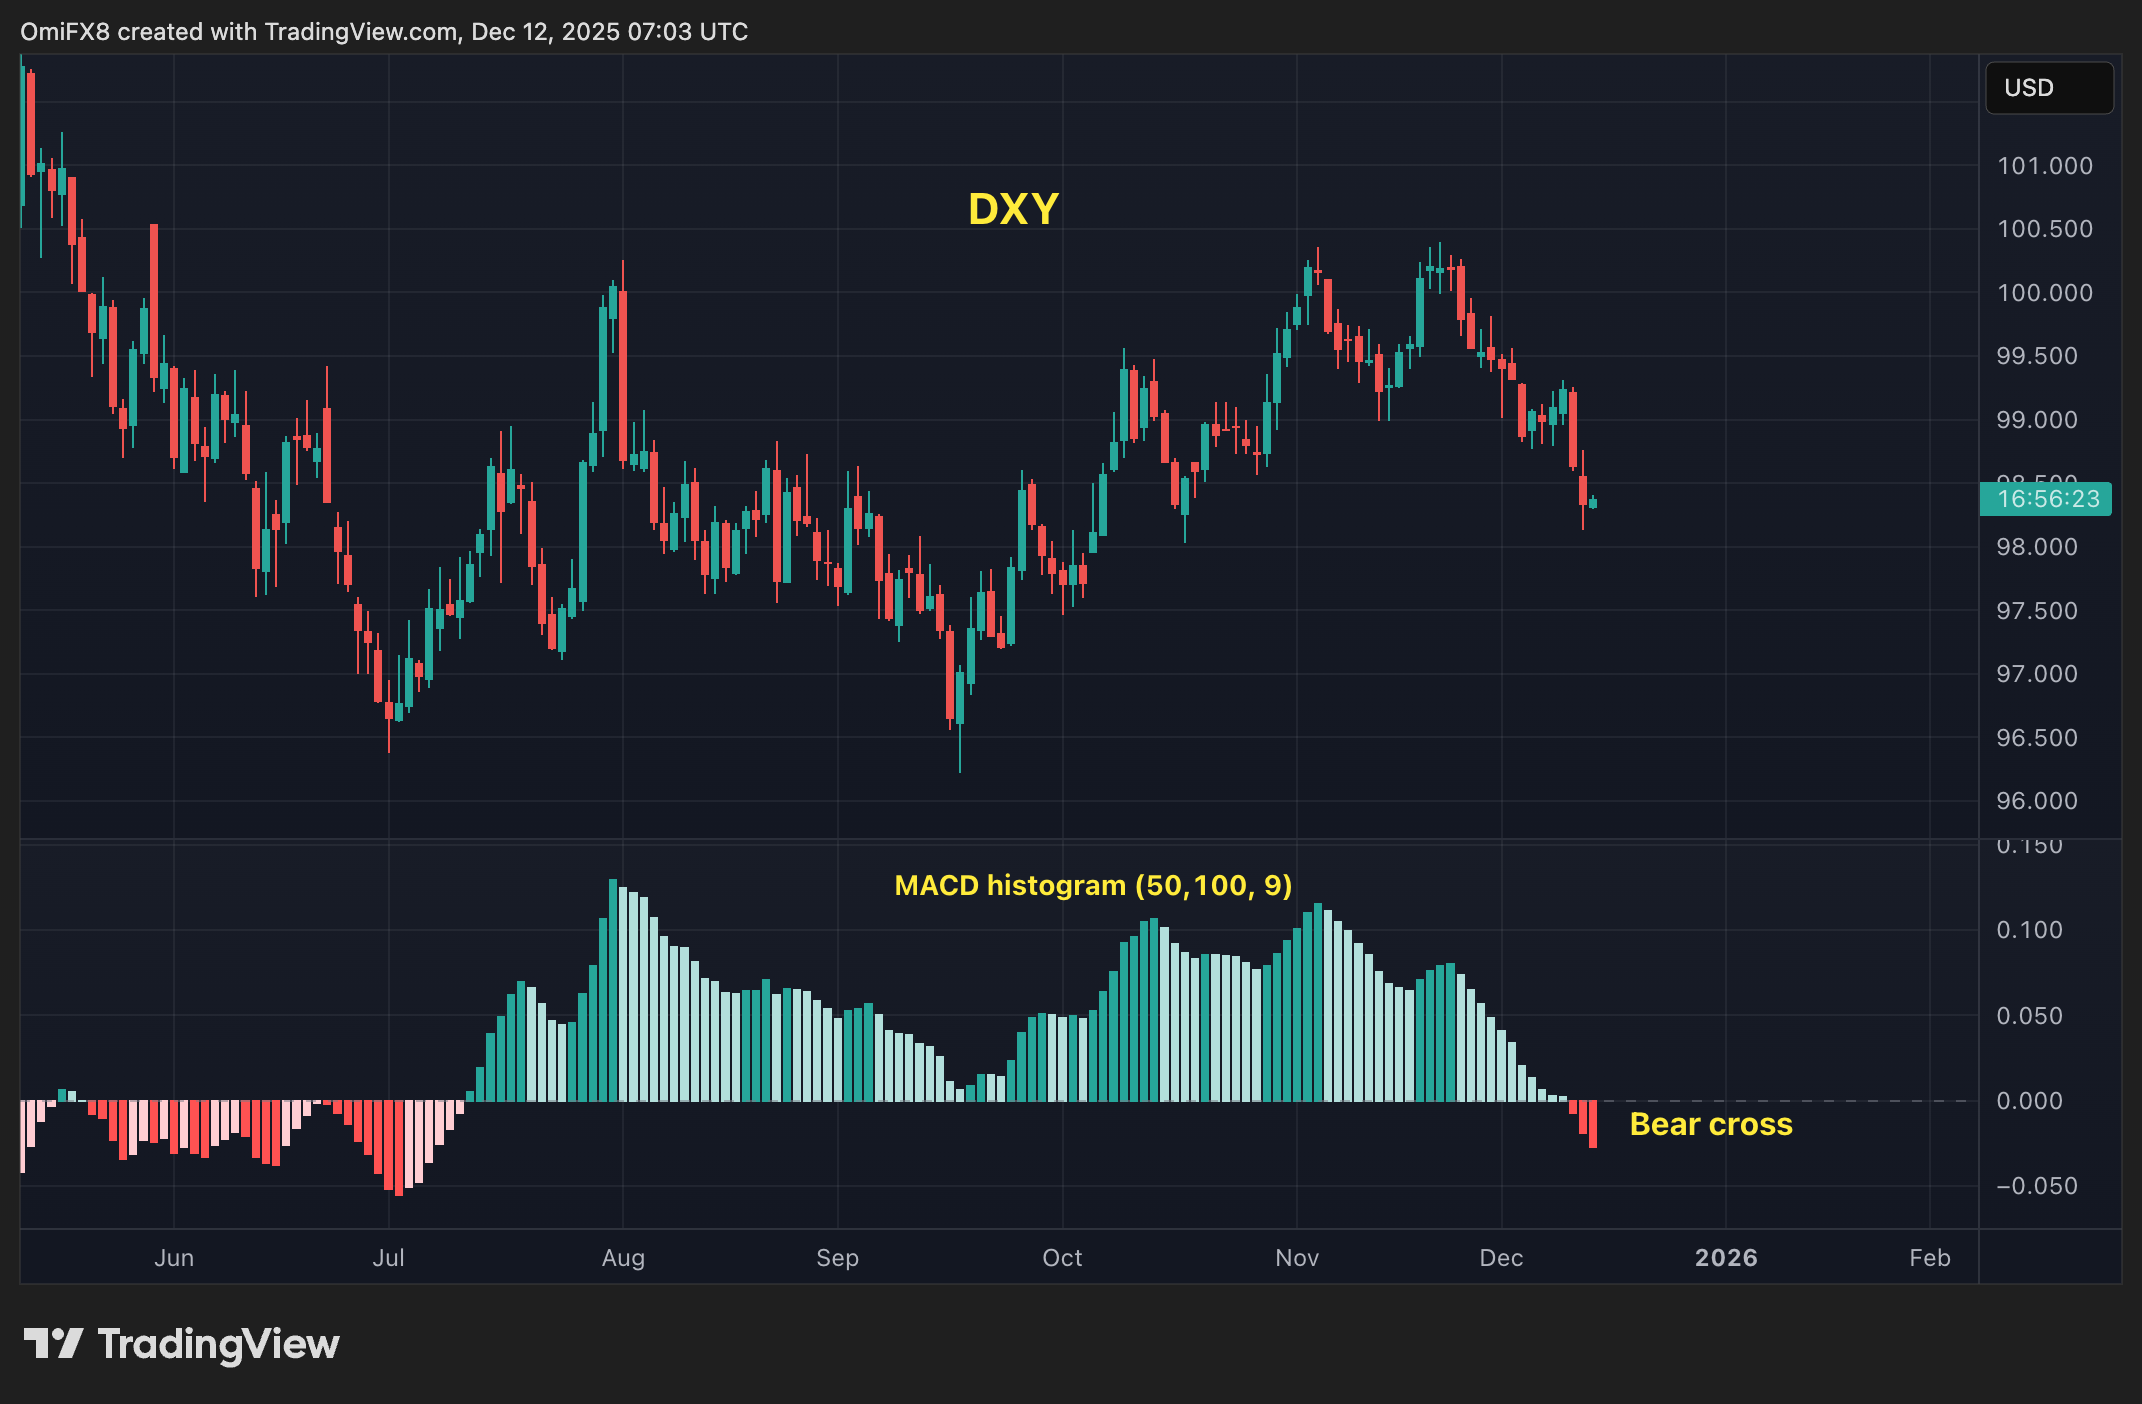
More importantly, the DXY's MACD histogram has flipped negative, indicating a bearish shift in momentum.
Nasdaq has found its footing after the November drop and now trades above the widely tracked 50-, 100-, and 200-day simple moving averages, offering bullish signals for the crypto market. Lastly, BTC sellers look to have run out of steam, as prices continue to hold steady despite reports that the U.S. Senate's crypto market structure bull has hit a roadblock.
If BTC prices do break out, several resistance levels between $97,000 and $108,000, identified by the 50-, 100-, and 200-day simple moving averages (SMA) and the Ichimoku Cloud, would come into focus.
That said, ETF flows remain a concern. As noted on Thursday, there hasn’t been a single day of net inflows exceeding $500 million in the past month. While prices have stabilized since Nov. 20, cumulative net inflows since the final week of November amount to just $219 million, according to data from SoSoValue. That's a paltry figure compared with the billions in redemptions seen through October and early November.
While Nasdaq trading above its key averages is good news for the BTC bulls, the cryptocurrency's correlation with the tech index has become lopsided. Bitcoin drops more sharply when the Nasdaq falls, yet rises only modestly on Nasdaq rallies.
So, we cannot completely rule out a potential bear case in BTC, involving a breakdown below the mini ascending channel. Such a move would expose support around $80,000.
Disclaimer: The content of this article solely reflects the author's opinion and does not represent the platform in any capacity. This article is not intended to serve as a reference for making investment decisions.
You may also like
Bitcoin Leverage Wipeout: Systemic Threats in Cryptocurrency Derivatives Markets
- 2025 Bitcoin leverage liquidation events ($19B+ in October, $543M in December) exposed systemic risks in crypto derivatives markets, with Bitcoin short positions disproportionately affected. - Crisis revealed interconnectedness between crypto and traditional finance, as stablecoin de-pegging and liquidity shocks impacted U.S. Treasury markets and midcap tokens. - Regulators intensified oversight: FSB identified stablecoin/CASP gaps, Basel Committee adjusted prudential rules, and 70%+ jurisdictions advanc

Clean Energy Market Fluidity: How REsurety's CleanTrade Platform is Transforming Institutional Participation and Risk Strategies in Renewable Energy Trading
- REsurety's CleanTrade platform standardizes green energy trading, boosting institutional liquidity and risk management. - Launched in 2025, it facilitated $16B in trades, enabling transparent VPPA/PPA/REC trading and ESG-aligned hedging. - CFTC oversight reduces counterparty risk, aligning with decarbonization goals amid policy uncertainties. - Despite challenges like rising rates, CleanTrade bridges gaps by standardizing pricing and aggregating demand.

The Emergence of Clean Energy Derivatives: How CleanTrade is Transforming Institutional Investment in Renewable Resources
- CleanTrade's CFTC-approved SEF designation in 2025 revolutionizes clean energy derivatives by introducing institutional-grade liquidity and standardized trading for VPPAs, PPAs, and RECs. - The platform's $16B notional trading volume within two months demonstrates rapid institutional adoption, with major players like Cargill leveraging its transparent infrastructure to manage energy risks. - Integrated ESG analytics and automated compliance tools enable investors to align portfolios with sustainability g

The Emergence of CFTC-Regulated Clean Energy Platforms and Their Influence on Institutional Investment Approaches
- CFTC-approved CleanTrade, the first SEF for VPPAs/RECs, transforms clean energy markets by addressing liquidity, transparency, and regulatory challenges. - Its $16B trading volume and Cargill-Mercuria's first transaction demonstrate institutional adoption of standardized, verifiable renewable energy assets. - CleanTrade enables ESG alignment through project-specific carbon tracking, reducing emissions by 15% for investors while complying with IRA-driven $2.2T global investments. - By bridging financial a