
Cardano Touches 20-Day SMA but Bulls Eye Retest of Further Resistance at $0.50

Cardano is testing its 20-day SMA after a strong rebound, but a break above the upper Bollinger band must ensue to extend the recovery.
Today, Cardano is holding a strong intraday tone after an aggressive upward push, trading near the top of its session range. Over the past 24 hours, ADA has moved between $0.39 and $0.45, spending most of that period in steady ascent. The token is also showing notable short-term strength, posting an impressive 14.9% gain over the past day and maintaining a positive 7-day performance of nearly 5%.
Across the 14-day window, ADA is still slightly in decline, reflecting the recent corrective phase that preceded the current rebound. However, the latest daily move suggests momentum is beginning to shift back in favor of buyers. With its price consolidating around the upper end of the daily range, traders are watching out for directional moves. Will ADA translate this renewed strength into a sustained breakout?
Cardano Price Analysis
On the daily chart, ADA has bounced off the lower Bollinger Band, signaling that sellers may be losing control while buyers attempt to reclaim ground. Price has touched the middle band (20-day SMA), which acted as the first major resistance zone.
A decisive break above this level would strengthen the short-term bullish case and open room for a retest of the upper Bollinger Band, sitting at $0.50. This level rejected a recovery attempt from around November 15. Until such a breakout occurs, this mid-band remains the key barrier that ADA must clear to confirm trend reversal momentum.
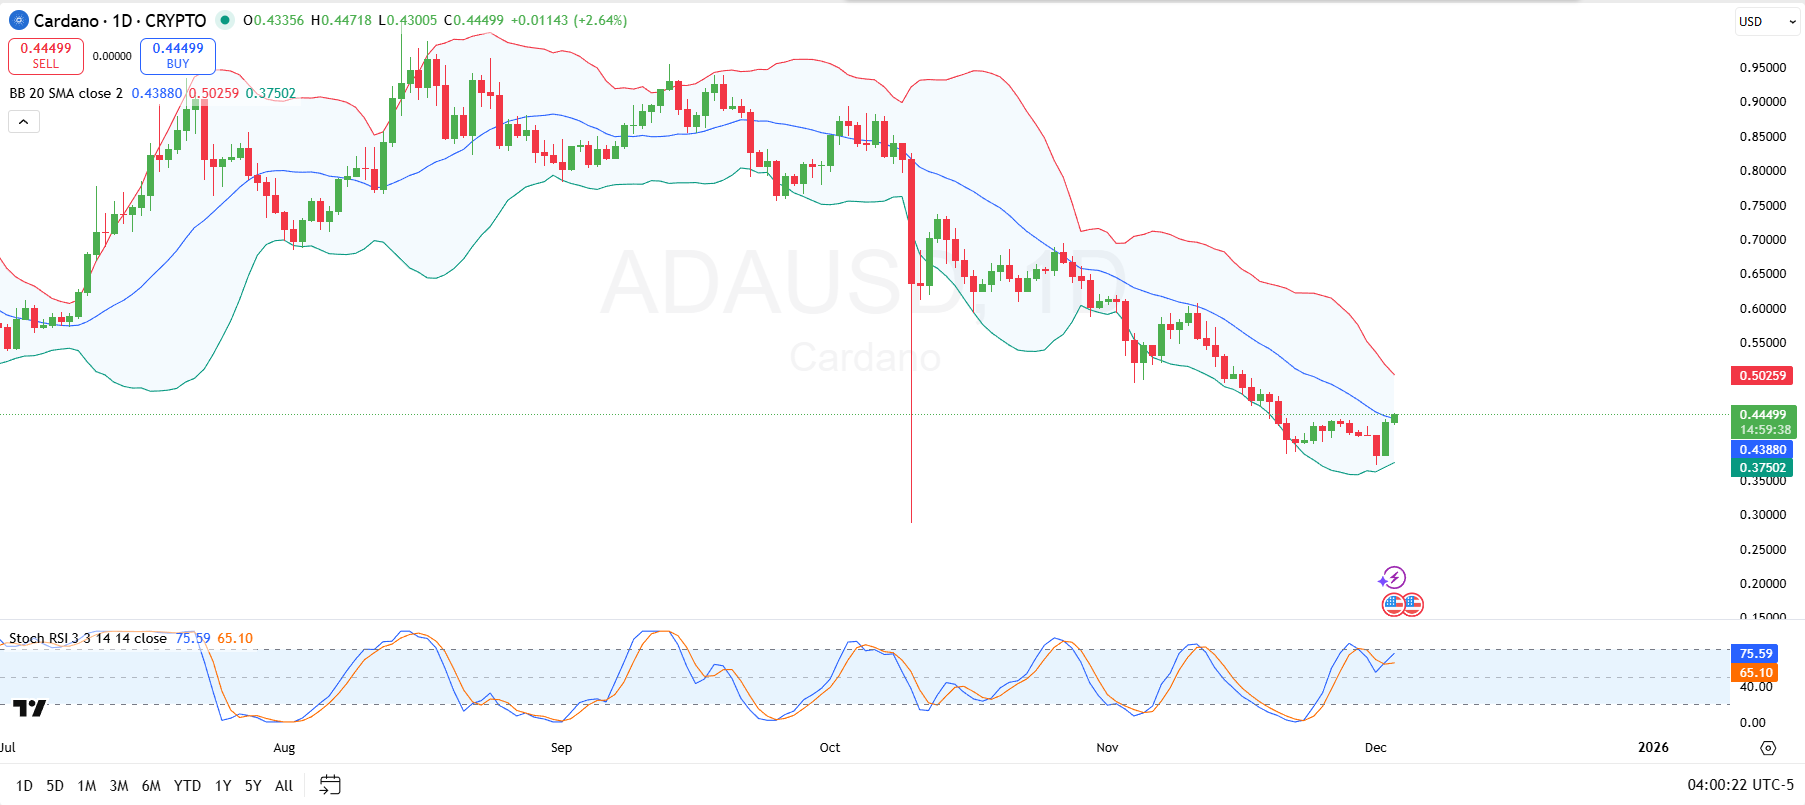
Below current levels, structural support sits near the lower Bollinger Band at $0.37, which has previously cushioned pullbacks. Maintaining closes above this line would reinforce the emerging rebound structure and signal that the market is shifting away from oversold conditions.
Meanwhile, the Stochastic RSI, now rising sharply and shooting towards overbought levels, further reflects improving sentiment and suggests declining selling pressure as long as bullish momentum continues to build.
Further, the %K line, which reacts more quickly to price changes, has already pushed above the midpoint, currently sitting ahead of the %D line. This crossover is an early bullish signal, typically suggesting that buyers are gaining strength. Together, these indicators show that ADA is attempting to transition from defensive posture to early recovery.
What ADA Commentators Say
On the commentary end, market analyst Trend Rider noted on X that Cardano has just printed its first bullish “Super Signal” on the daily timeframe since falling below the key support zone around the $0.55 region.
According to him, this alert typically increases the probability of a short-lived recovery, often spanning only one to four candles, and should not be mistaken for evidence of a trend reversal.
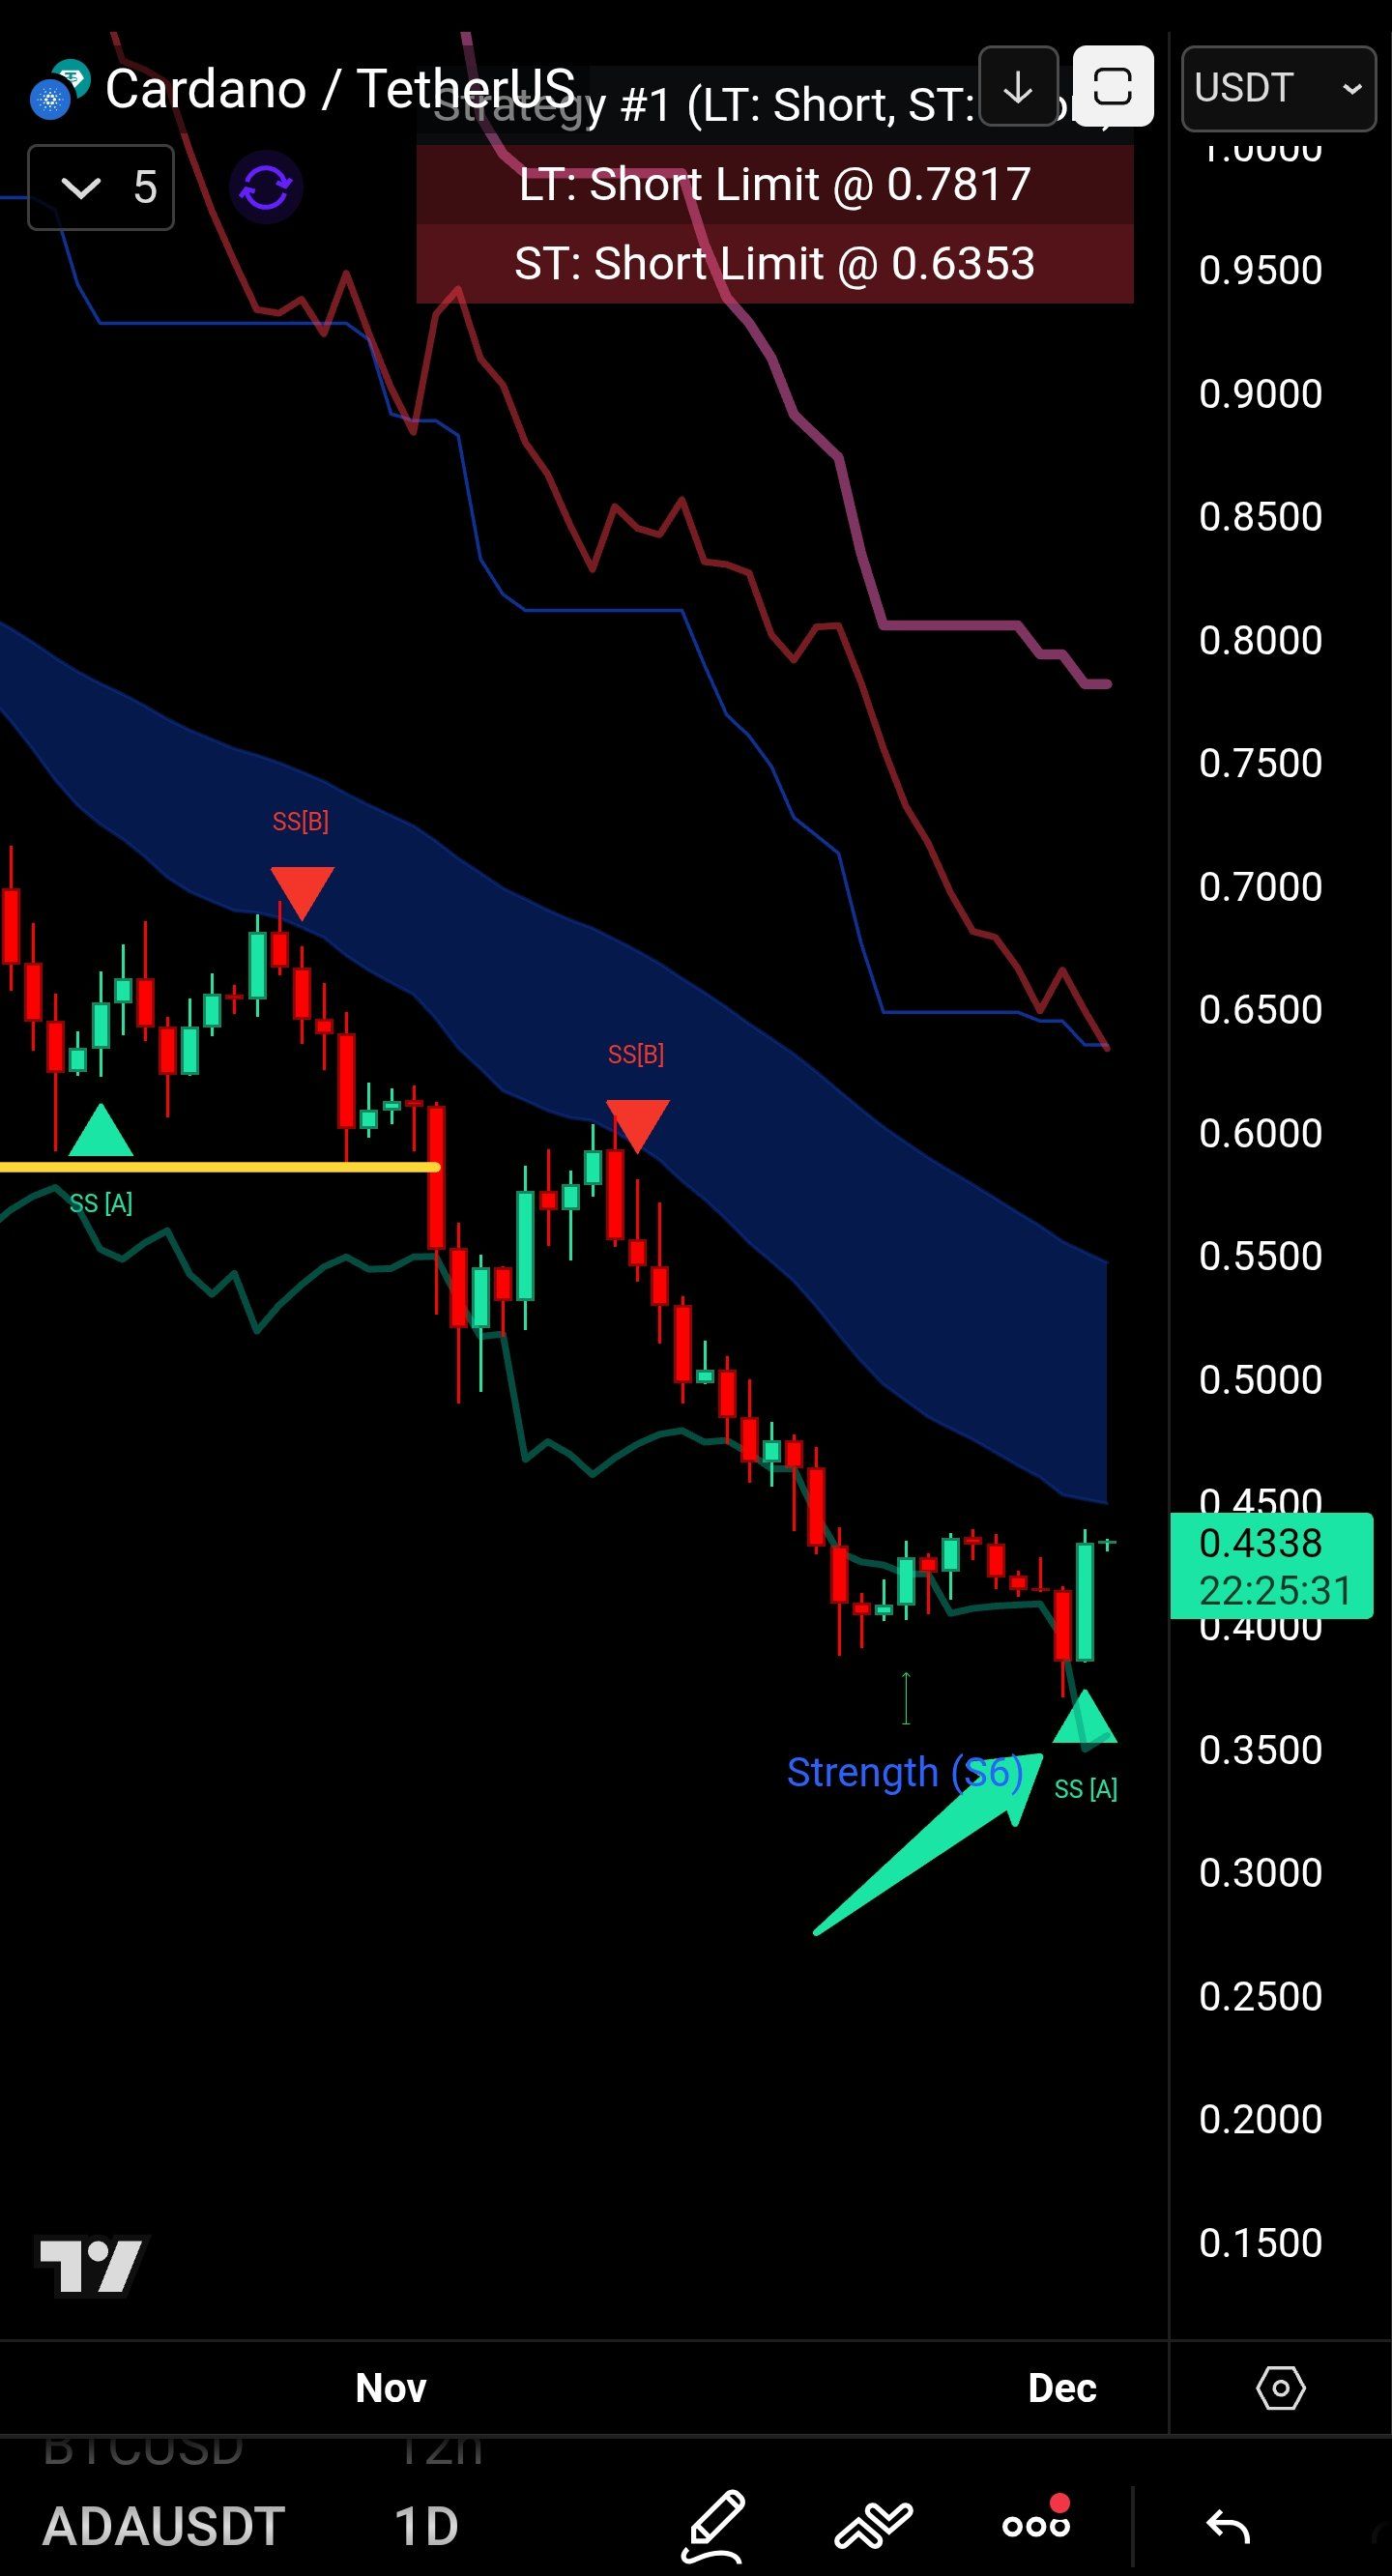
Trend Rider also said that broader sentiment remains neutral to bearish until ADA can reclaim trading levels above the blue band on his chart around $0.45 to $0.55. For now, the $0.55 level acts as the major reference point for whether the asset can rebuild a bullish foundation.
Disclaimer: The content of this article solely reflects the author's opinion and does not represent the platform in any capacity. This article is not intended to serve as a reference for making investment decisions.
You may also like
Hyperliquid (HYPE) Price Rally: The Role of DeFi Advancements and Investor Sentiment in Driving Recent Market Fluctuations
- Hyperliquid (HYPE) surged to $59.39 in 2025 before retreating, driven by DeFi innovations and volatile market sentiment. - Technical advancements like HyperBFT consensus and USDH stablecoin attracted 73% of decentralized trading volume, while institutional partnerships stabilized the ecosystem. - Despite short-term volatility near $36, bullish RSI patterns and $3 trillion trading volume suggest potential for a $59 rebound, though sustained momentum above $43 is critical. - Analysts project HYPE could rea

The Driving Forces Behind Economic Growth in Webster, NY
- Webster , NY, transformed a 300-acre Xerox brownfield into a high-tech industrial hub via a $9.8M FAST NY grant, boosting industrial and real estate growth. - Public-private partnerships enabled infrastructure upgrades, attracting $650M fairlife® dairy projects and 250 high-paying jobs by 2025. - Industrial vacancy rates dropped to 2%, while residential values rose 10.1% annually, highlighting synergies between infrastructure and economic development. - The model underscores secondary markets' potential
Unlocking Potential: The Impact of Targeted Grants and Public-Private Partnerships on Transforming Medium-Sized Real Estate Markets in the U.S.
- U.S. mid-sized cities leverage infrastructure investment and PPPs to drive commercial real estate growth, outpacing large cities in value creation. - Federal programs like IIJA enable upgrades in transportation and broadband, reducing business costs while boosting property values in Tampa and Grand Rapids. - PPPs in cities like Montgomery County combine affordable housing incentives with CRE development, balancing equity and economic resilience through data-driven strategies. - Market projections show $2
Modern Monetary Theory and the Transformation of International Markets: Inflation Trends, Asset Movements, and Currency Shifts in 2025
- Modern Monetary Theory (MMT) reshapes fiscal-monetary coordination, linking government spending to inflation and resource constraints in post-pandemic economies. - Central banks face challenges anchoring inflation expectations as CPI lags asset market pressures, risking self-fulfilling inflationary spirals amid eroding public trust. - Currency valuations shift with fiscal stimulus (e.g., euro's 2025 rebound) and U.S. dollar uncertainty, compounded by gold reserve diversification and rising bond yields. -
