Bitget App
Trade smarter
Buy cryptoMarketsTradeFuturesEarnSquareMore
Is Solana (SOL) Poised for a Breakout? This Key Bullish Pattern Suggests So!

Is Solana (SOL) Poised for a Breakout? This Key Bullish Pattern Suggests So!

CoinsProbeCoinsProbe2025/12/03 18:00
By:Nilesh Hembade

Date: Wed, Dec 03, 2025 | 02:04 PM GMT

The broader cryptocurrency market is showing a notable rebound from the Dec 01 selloff as the prices of both Bitcoin (BTC) and Ethereum (ETH) trade in green with impressive 7% gains in the last 24 hours respectively. This recovery has allowed several altcoins to bounce back, including Solana (SOL).

SOL is up 6% today, and more importantly, the chart is now highlighting a classic bullish formation that could fuel a strong upside continuation — if the breakout level is reclaimed.

Is Solana (SOL) Poised for a Breakout? This Key Bullish Pattern Suggests So! image 0 
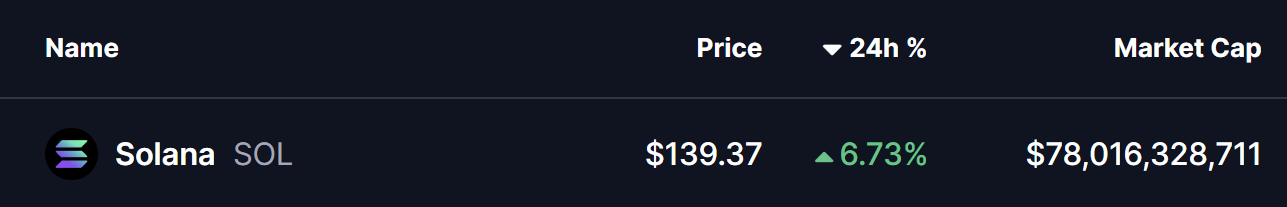
Source: Coinmarketcap

Double Bottom Formation in Play

On the 4H chart, SOL is forming a clean double bottom pattern — one of the most reliable bullish reversal structures in technical analysis. The formation becomes valid when the price prints two distinct lows near the same level, followed by a strong rebound from the second bottom.

The first bottom developed when SOL dipped into the $121 zone, which led to a sharp bounce toward the neckline resistance between $142.25 and $144.75. However, the price failed to break through and corrected back down, retesting the same support around $123 — marking the second bottom of the pattern.

Is Solana (SOL) Poised for a Breakout? This Key Bullish Pattern Suggests So! image 1 
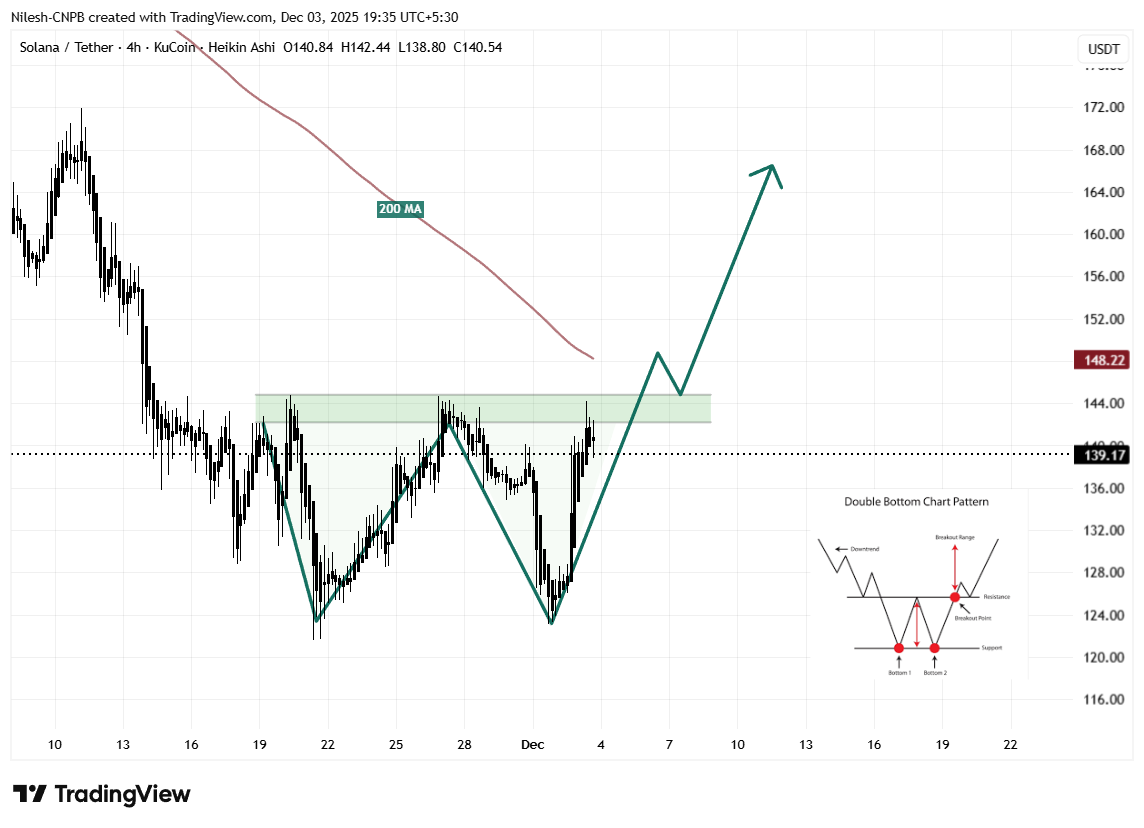
Solana (SOL) 4H Chart/Coinsprobe (Source: Tradingview)

From this level, SOL surged aggressively and now trades near $139.17, placing it directly below the neckline resistance. This region is crucial, as it determines whether buyers can trigger the next major leg higher.

What’s Next for SOL?

If the double bottom structure continues to unfold as expected, the key step ahead is a clean breakout above $144.75. A strong 4H candle close above the neckline — ideally with rising volume — would confirm the pattern’s activation.

Once confirmed, this setup projects an upside target near $166.30, representing an additional 19% move from current levels. This target aligns well with the broader bullish sentiment returning across the market.

For now, SOL’s market structure remains constructive. Reclaiming the 200-MA at $148.22 after the breakout, along with a successful retest of the neckline, would further strengthen the bullish case and give traders more confidence in a sustained upward move.

0
0

Disclaimer: The content of this article solely reflects the author's opinion and does not represent the platform in any capacity. This article is not intended to serve as a reference for making investment decisions.

PoolX: Earn new token airdrops
Lock your assets and earn 10%+ APR
Lock now!

You may also like

Hyperliquid (HYPE) Price Rally: The Role of DeFi Advancements and Investor Sentiment in Driving Recent Market Fluctuations

- Hyperliquid (HYPE) surged to $59.39 in 2025 before retreating, driven by DeFi innovations and volatile market sentiment. - Technical advancements like HyperBFT consensus and USDH stablecoin attracted 73% of decentralized trading volume, while institutional partnerships stabilized the ecosystem. - Despite short-term volatility near $36, bullish RSI patterns and $3 trillion trading volume suggest potential for a $59 rebound, though sustained momentum above $43 is critical. - Analysts project HYPE could rea

Bitget-RWA2025/12/03 21:34
Hyperliquid (HYPE) Price Rally: The Role of DeFi Advancements and Investor Sentiment in Driving Recent Market Fluctuations

The Driving Forces Behind Economic Growth in Webster, NY

- Webster , NY, transformed a 300-acre Xerox brownfield into a high-tech industrial hub via a $9.8M FAST NY grant, boosting industrial and real estate growth. - Public-private partnerships enabled infrastructure upgrades, attracting $650M fairlife® dairy projects and 250 high-paying jobs by 2025. - Industrial vacancy rates dropped to 2%, while residential values rose 10.1% annually, highlighting synergies between infrastructure and economic development. - The model underscores secondary markets' potential

Bitget-RWA2025/12/03 21:34
The Driving Forces Behind Economic Growth in Webster, NY

Unlocking Potential: The Impact of Targeted Grants and Public-Private Partnerships on Transforming Medium-Sized Real Estate Markets in the U.S.

- U.S. mid-sized cities leverage infrastructure investment and PPPs to drive commercial real estate growth, outpacing large cities in value creation. - Federal programs like IIJA enable upgrades in transportation and broadband, reducing business costs while boosting property values in Tampa and Grand Rapids. - PPPs in cities like Montgomery County combine affordable housing incentives with CRE development, balancing equity and economic resilience through data-driven strategies. - Market projections show $2

Bitget-RWA2025/12/03 21:14

Modern Monetary Theory and the Transformation of International Markets: Inflation Trends, Asset Movements, and Currency Shifts in 2025

- Modern Monetary Theory (MMT) reshapes fiscal-monetary coordination, linking government spending to inflation and resource constraints in post-pandemic economies. - Central banks face challenges anchoring inflation expectations as CPI lags asset market pressures, risking self-fulfilling inflationary spirals amid eroding public trust. - Currency valuations shift with fiscal stimulus (e.g., euro's 2025 rebound) and U.S. dollar uncertainty, compounded by gold reserve diversification and rising bond yields. -

Bitget-RWA2025/12/03 20:56
Modern Monetary Theory and the Transformation of International Markets: Inflation Trends, Asset Movements, and Currency Shifts in 2025
© 2025 Bitget