HBAR Is Close to Losing Its Only Bullish Setup Despite The Price Rise — Here’s Why

HBAR price recovered almost 26% from its November 21 low near $0.12. The price is up about 4% in the last 24 hours, which looks like a decent short-term recovery. But the bounce doesn’t look convincing. The only bullish setup on the chart is weakening fast, and the indicators show fading strength rather than growing
HBAR price recovered almost 26% from its November 21 low near $0.12. The price is up about 4% in the last 24 hours, which looks like a decent short-term recovery.
But the bounce doesn’t look convincing. The only bullish setup on the chart is weakening fast, and the indicators show fading strength rather than growing support.
Cup-and-Handle Setup Is Weakening While Bull Power Drops
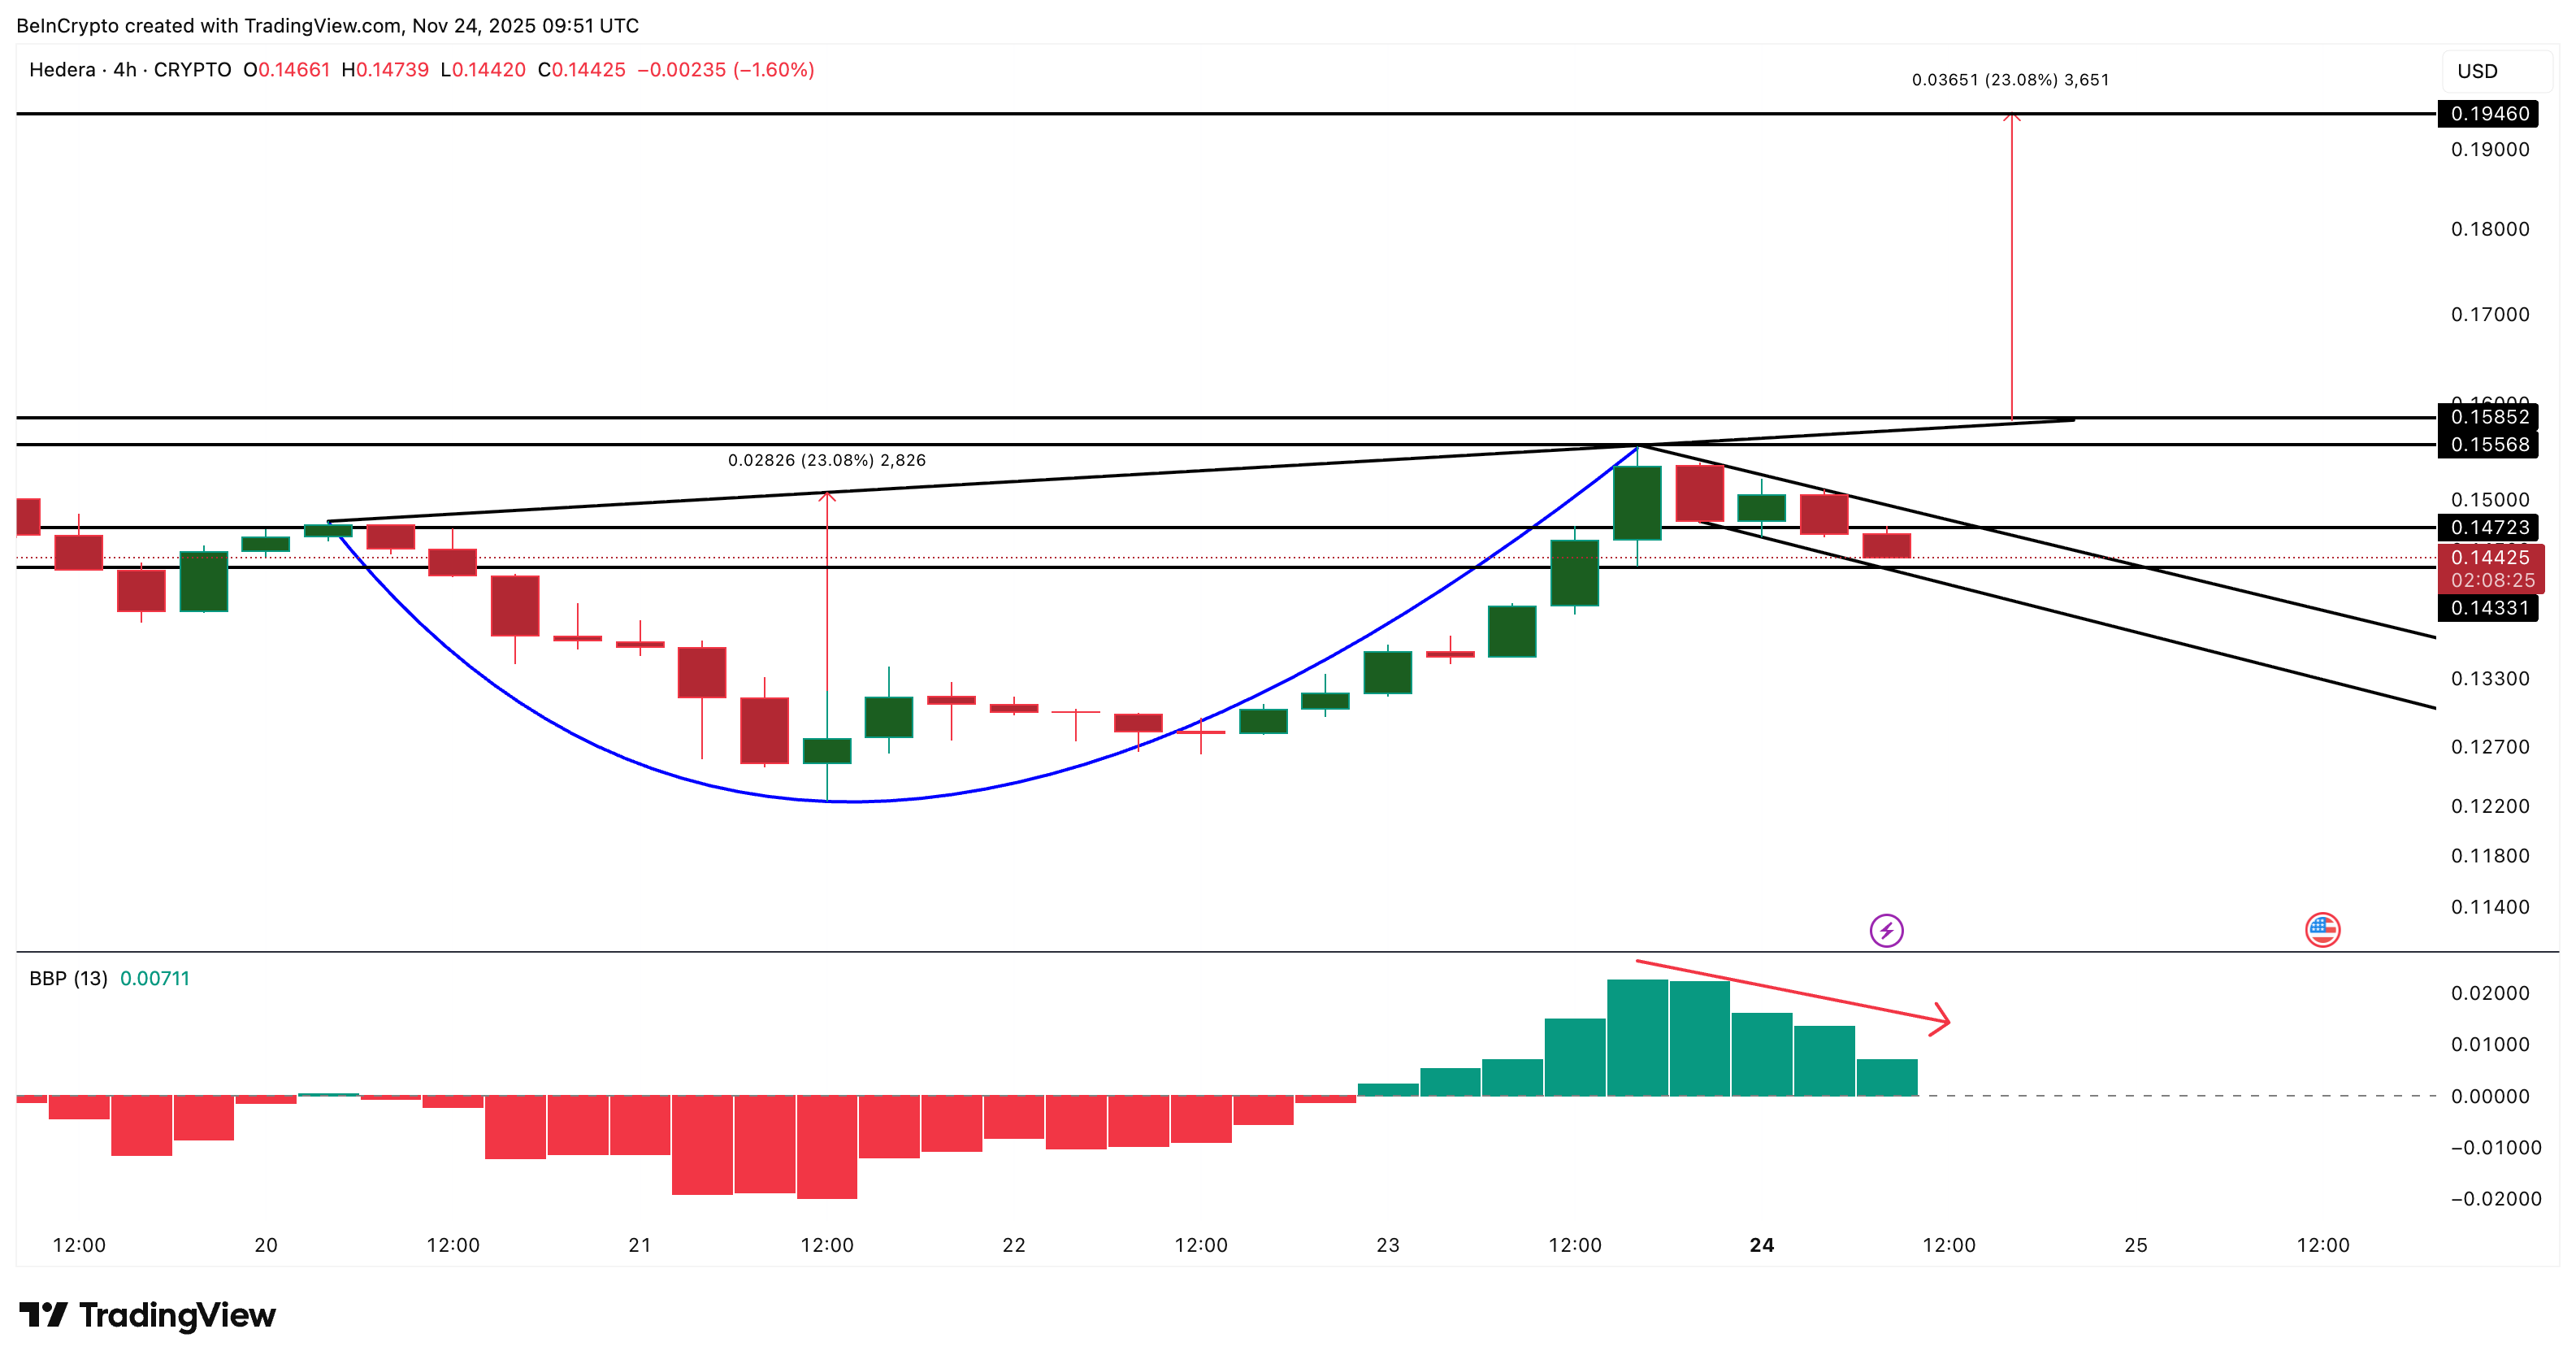
HBAR’s only short-term bullish case sits on the 4-hour chart. Between November 20 and November 23, the price created a cup-and-handle pattern. A cup-and-handle is a common bullish setup where price curves down and then up (the cup) before forming a small pullback (the handle). A breakout happens only when the price first closes above the handle’s top.
For HBAR, that breakout level is around $0.147.
A clean close above $0.158 breaks the cup itself and activates the pattern’s projected target near $0.194. Invalidation for this pattern lies under $0.143.
 HBAR Price Chart:
TradingView
HBAR Price Chart:
TradingView
Want more token insights like this? Sign up for Editor Harsh Notariya’s Daily Crypto Newsletter here.
But the issue is simple.
The Bull Bear Power (BBP) indicator, which compares market strength against average price, has been weakening since November 23. BBP is still positive, but it is sloping down, which means buyers are losing control right when the pattern needs momentum to break out.
This is normal during consolidation, but HBAR is losing strength too quickly. If the price falls under $0.143, the handle breaks to the downside. When that happens, the cup-and-handle setup collapses, and the only bullish trigger disappears.
Big Money Flow Isn’t Enough
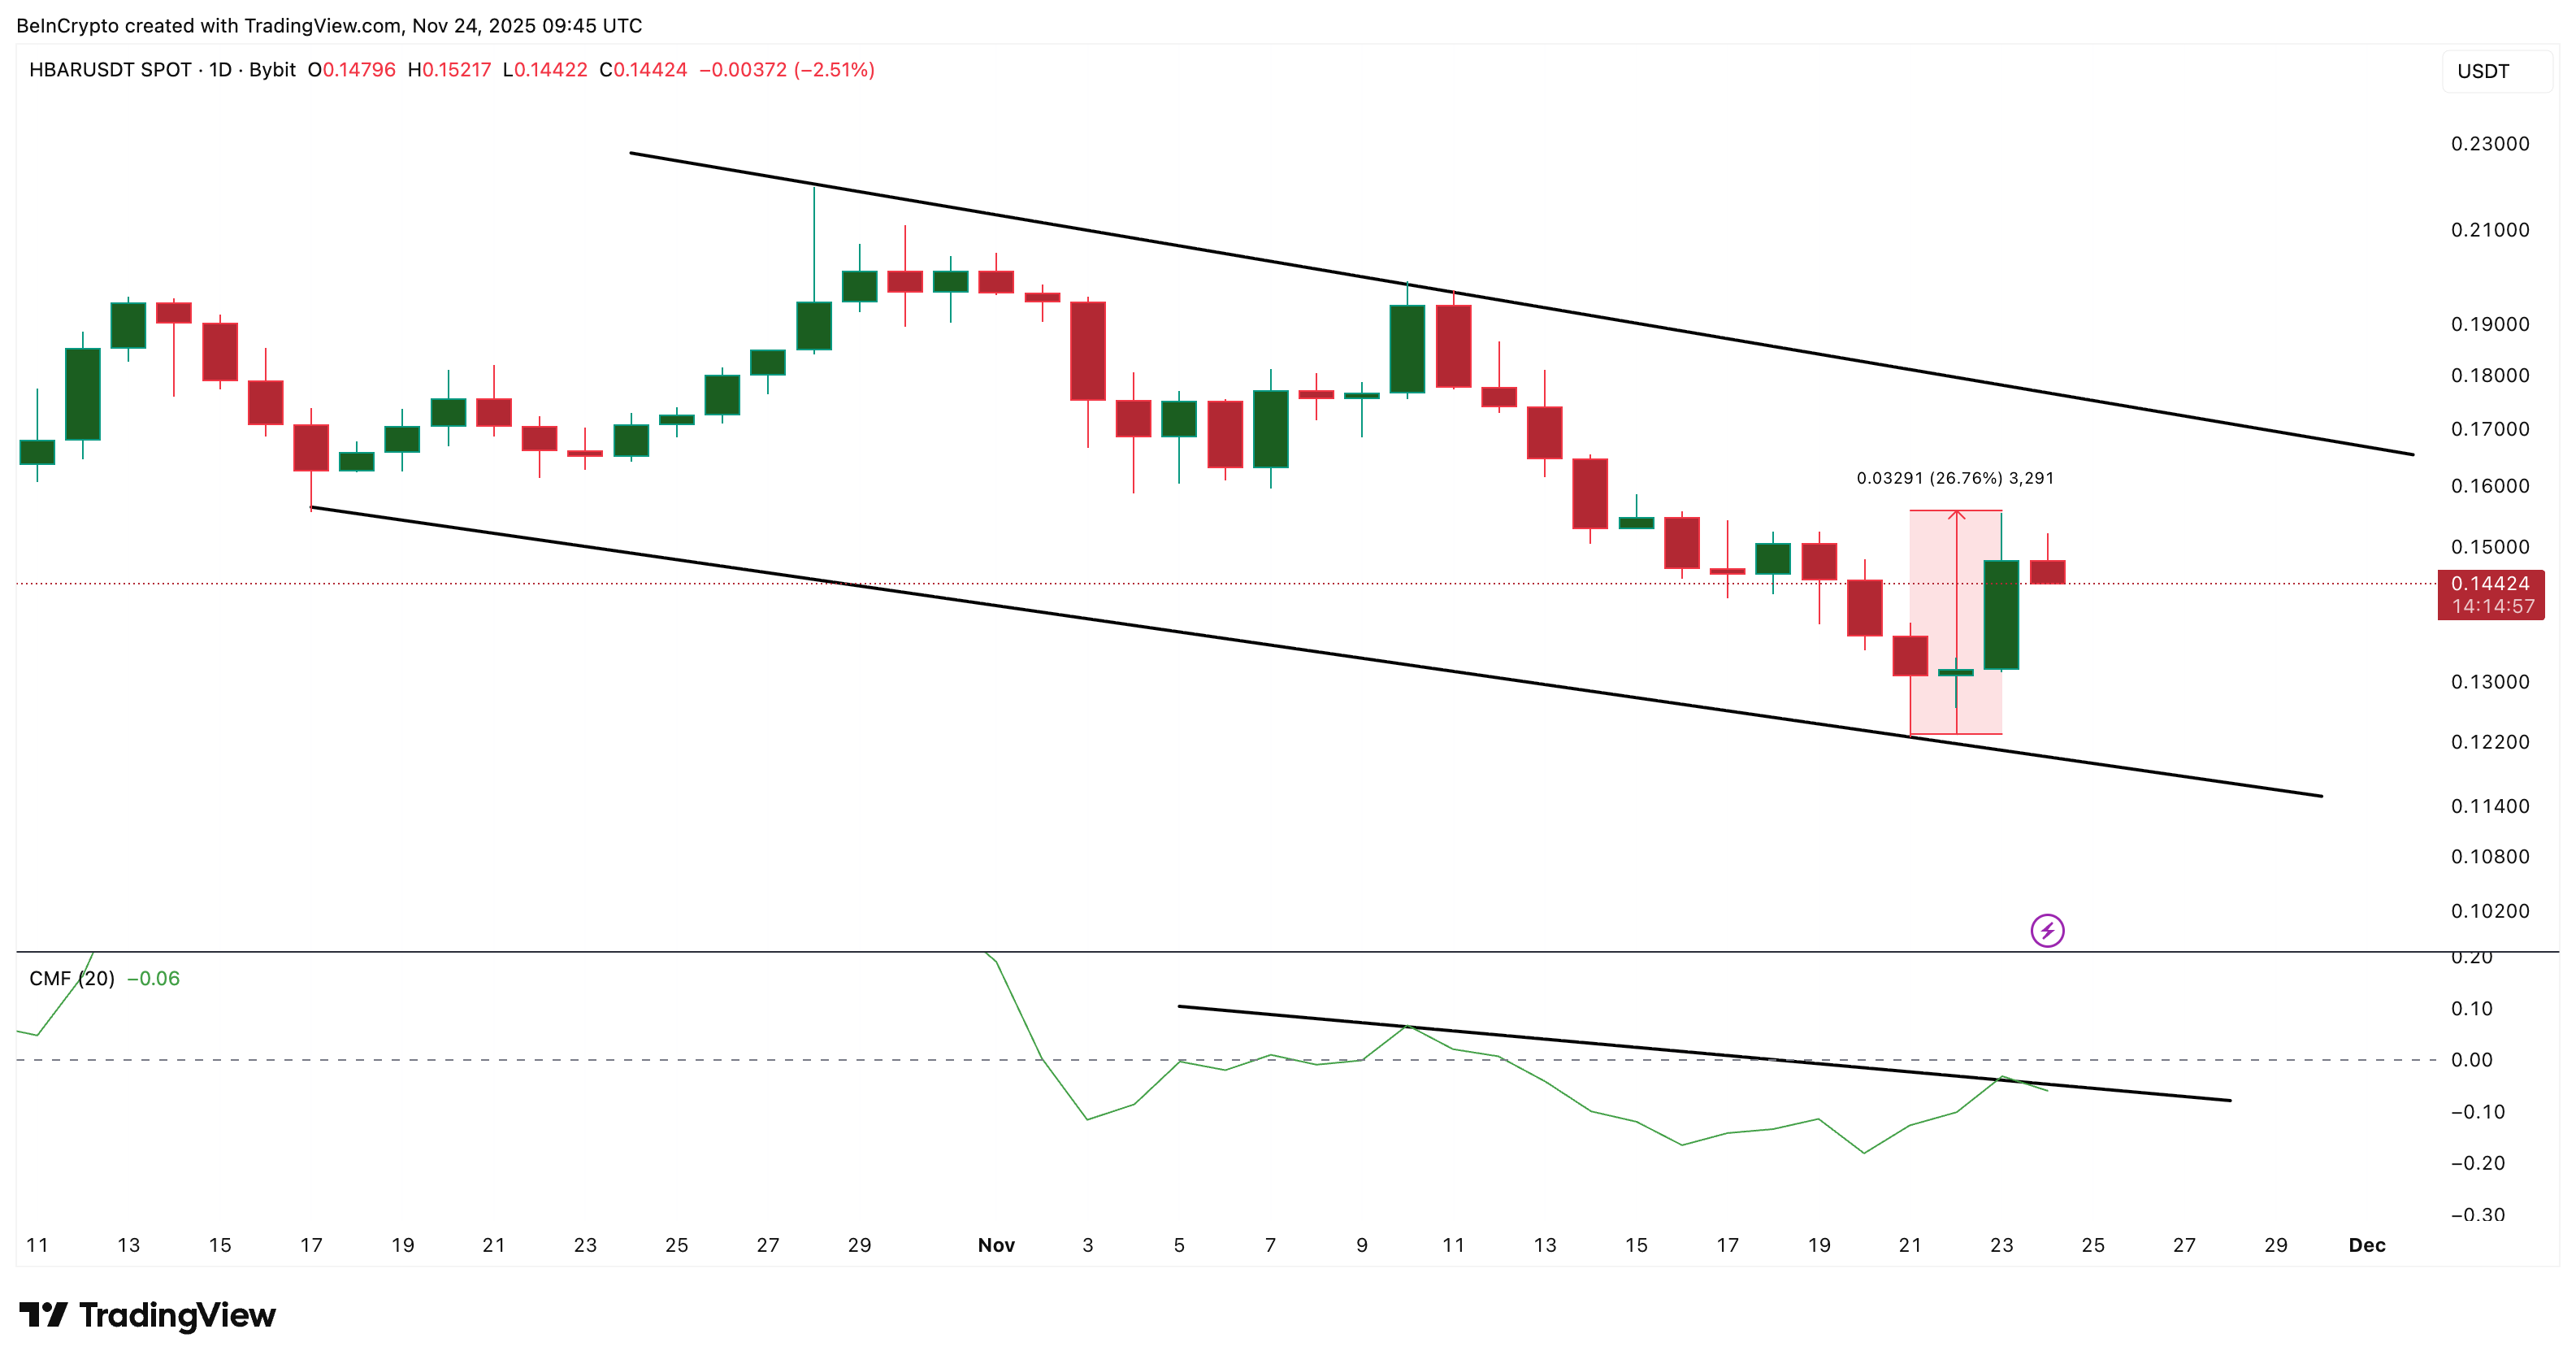
That weakness is also visible on the daily chart. HBAR is still trading inside a falling channel. A falling channel forms when both highs and lows drop in a straight, parallel path. Price touched the lower band of this channel on November 21 and bounced nearly 27%, but the move faded quickly.
The Chaikin Money Flow (CMF) explains why. CMF measures whether big money is flowing in or out of a token. It has been under its trendline since early November and has not crossed above zero. Big money is not supporting the bounce. A similar CMF failure on November 8–10 also led to a HBAR price drop.
 Bearish Money Flow:
TradingView
Bearish Money Flow:
TradingView
Until CMF breaks its trendline and moves above zero, every bounce is just a reaction, not a trend change. And that is why even the handle-breakout on the 4-hour is prone to failing.
HBAR Price Levels: The Bounce Is Still Weak Unless Key Breakouts Happen
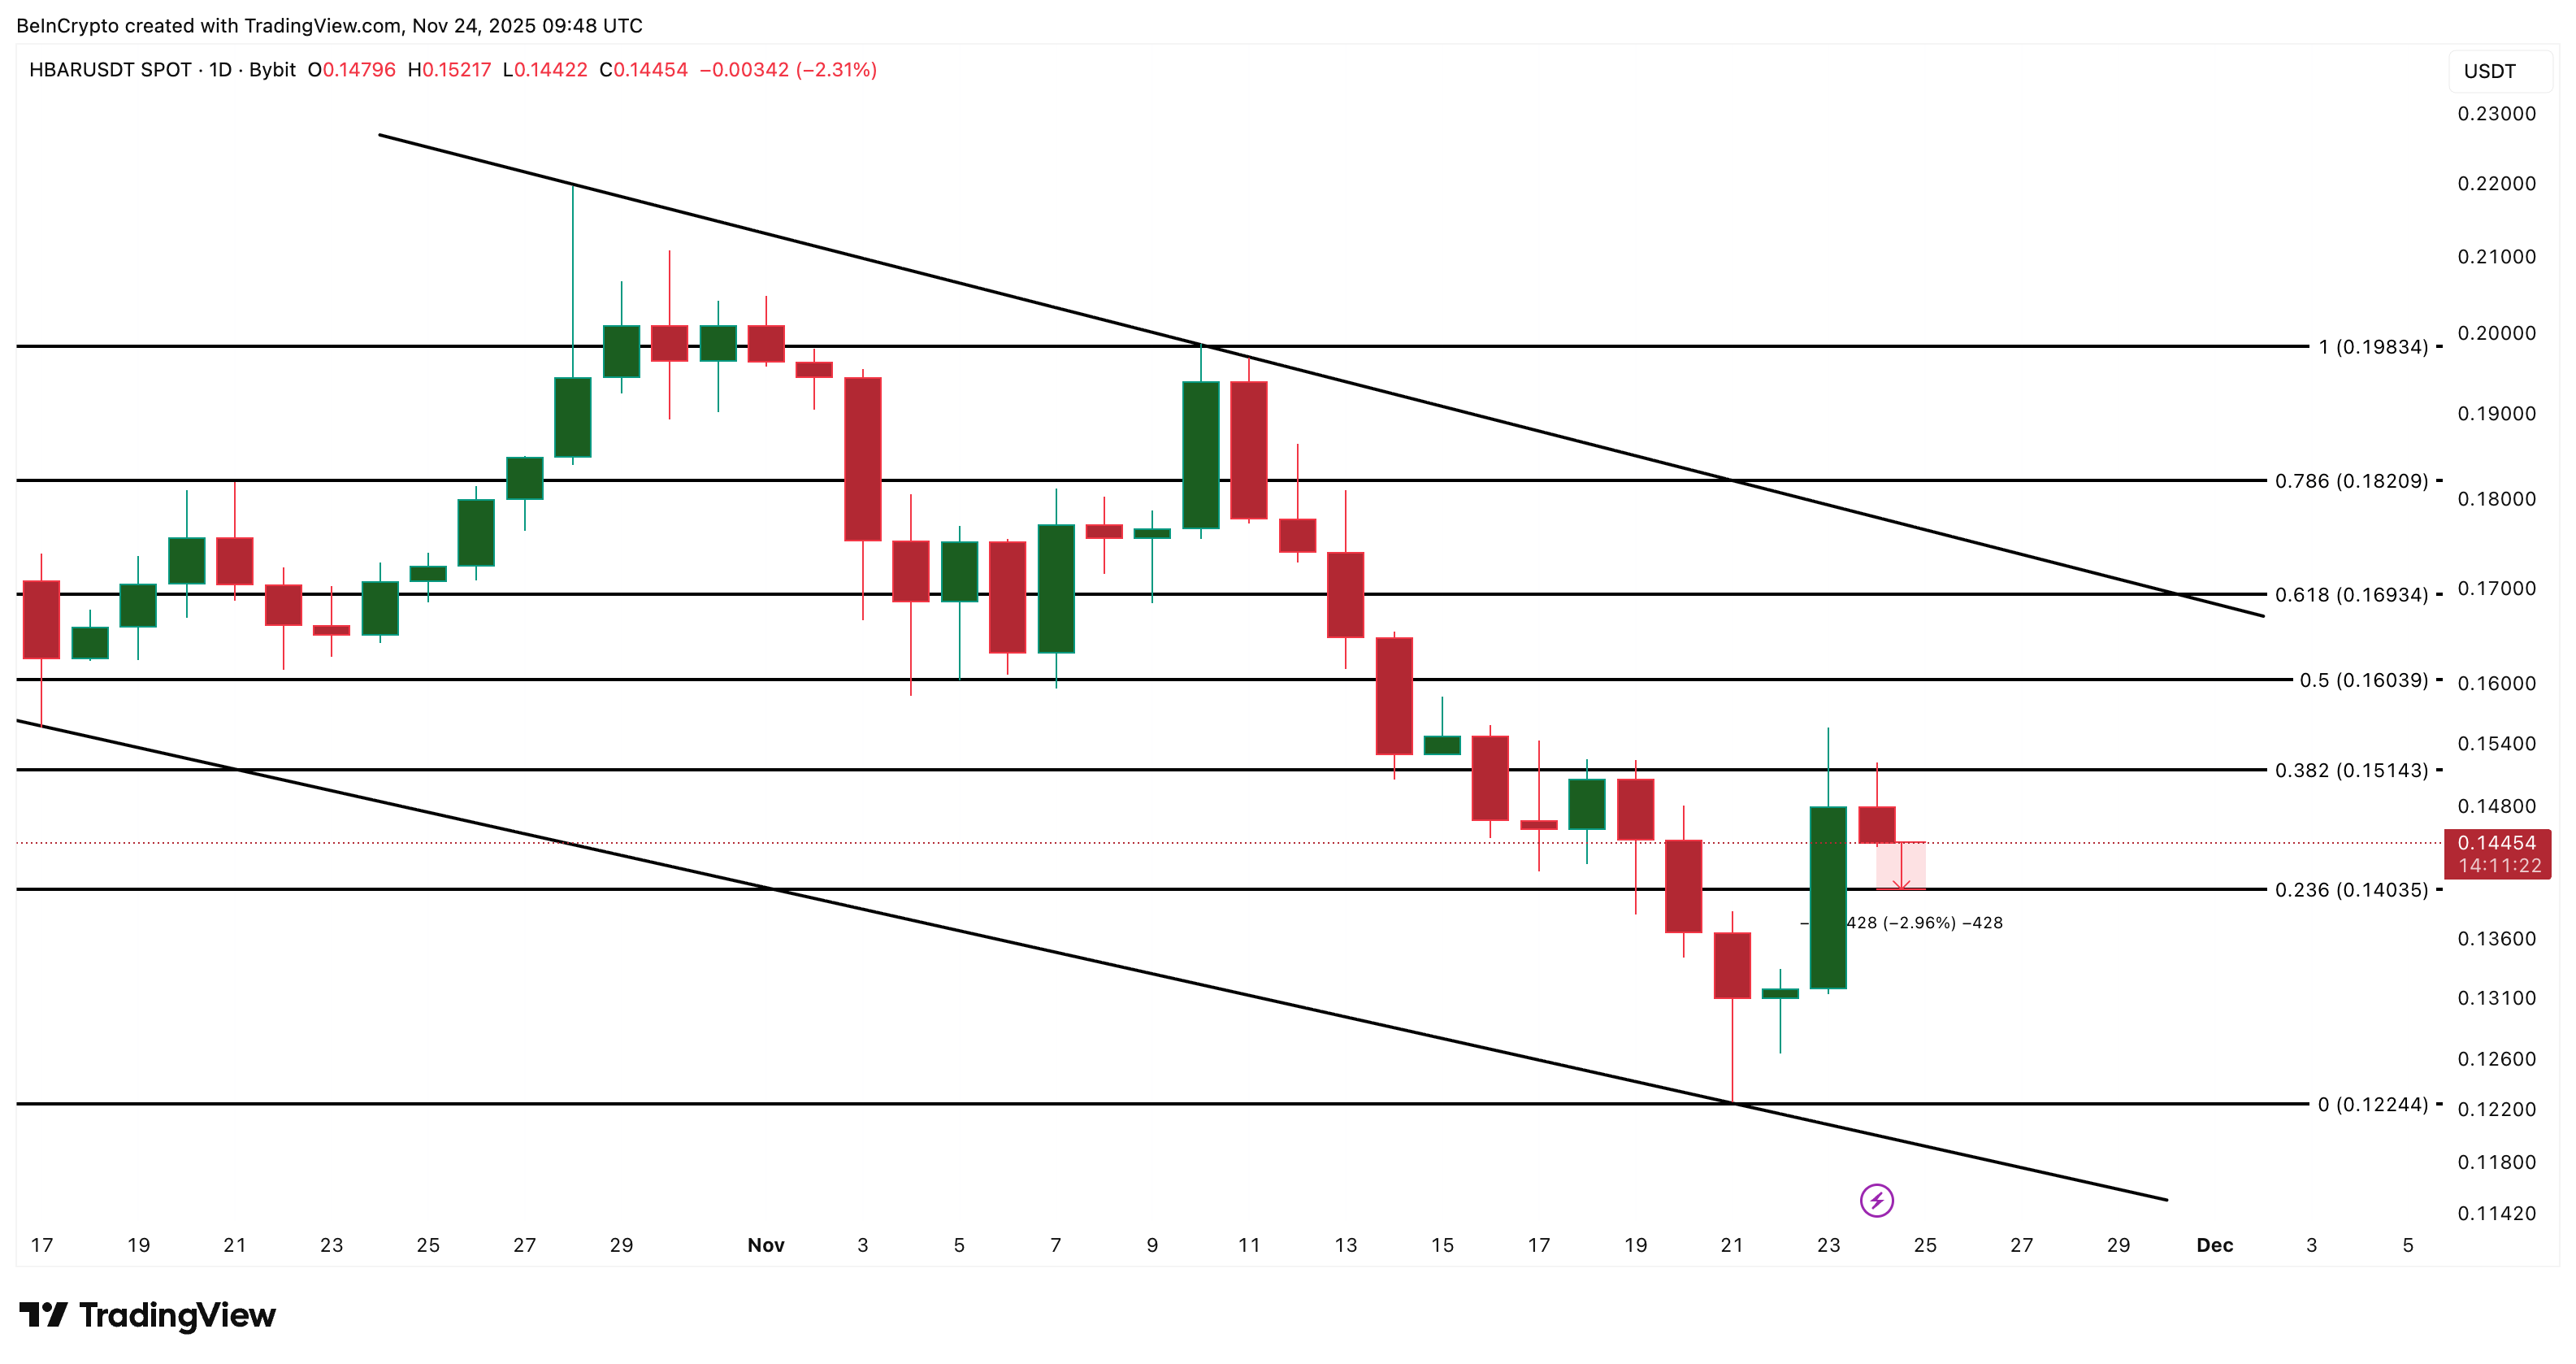
The daily HBAR price action confirms the same weakness.
To continue higher, HBAR must break:
- $0.169 — resistance from the 0.618 retracement and the upper trendline of the falling channel.
- $0.182 — the stronger daily resistance
However, these levels come into the picture if the key cup-and-handle levels: $0.147 and $0.158, break first.
None of these breakouts looks likely unless CMF turns positive and bulls regain strength on the 4-hour chart.
The downside remains clearer than the upside. A daily close under $0.140 exposes $0.122, the November 21 low, and the most important support on the chart. A drop under $0.140 would also invalidate the cup-and-handle formation from earlier.
 HBAR Price Analysis:
TradingView
HBAR Price Analysis:
TradingView
One more detail matters: the lower trendline of the falling channel has only two clean touch points, which makes it structurally weaker. That means breaking below it would not require much effort if selling pressure increases again.
To invalidate the bearish setup, HBAR must reclaim $0.169 first and then $0.182. Moving above these levels flips the structure and opens a path toward $0.198, but this requires strong bull power and a full CMF recovery.
Read the article at BeInCryptoDisclaimer: The content of this article solely reflects the author's opinion and does not represent the platform in any capacity. This article is not intended to serve as a reference for making investment decisions.
You may also like
India’s Spinny set to secure $160 million in funding for GoMechanic acquisition, sources report
PENGU Price Forecast: Managing Immediate Market Fluctuations and Exploring Future AI Opportunities
- PENGU token's price fell to $0.01114 in Nov 2025, far below its 2024 peak of $0.068, amid regulatory and macroeconomic risks. - Short-term volatility is amplified by SEC ETF delays, $7.68M short positions, and susceptibility to broader crypto market downturns. - Long-term potential emerges through AI-driven features like dynamic staking and cross-chain interoperability, plus Schleich's physical collectible partnerships. - Pudgy Penguins' hybrid digital-physical model, including Walmart retail presence, d

The Rise of Dynamic Clean Energy Markets
- CleanTrade, CFTC-approved as a Swap Execution Facility (SEF), transformed clean energy markets into institutional-grade assets by standardizing VPPAs, PPAs, and RECs. - The platform addressed fragmented pricing and opaque risks, enabling $16B in transactions within two months and bridging renewable assets with institutional capital. - Institutional investors now use CleanTrade’s tools to hedge fossil fuel volatility and lock in renewable energy prices, mirroring traditional energy strategies. - Global cl

COAI Token Fraud: Insights for Cryptocurrency Investors During Times of Regulatory Ambiguity
- COAI token's 88% collapse in late 2025 exposed systemic risks in AI-driven DeFi ecosystems, with $116.8M investor losses. - Governance flaws included 87.9% token concentration in ten wallets, untested AI stablecoins, and lack of open-source audits. - Panic selling accelerated by AI-generated misinformation and CEO resignation, amid conflicting global crypto regulations. - Lessons emphasize scrutinizing token distribution, demanding transparent audits, and avoiding jurisdictions with regulatory ambiguity.