Date: Fri, Nov 21, 2025 | 09:25 AM GMT
The cryptocurrency market continues to face heavy selling pressure as both Bitcoin (BTC) and Ethereum (ETH) plunged over 9% in the past 24 hours. The correction triggered more than $1.93 billion in liquidations across the market, with long positions taking the biggest hit — over $1.79 billion wiped out in a single day.
This intense volatility has weighed heavily on major altcoins, including Hedera (HBAR), which is down more than 11%. But beneath this deep pullback, the chart reveals a technical structure that may be preparing HBAR for a potential rebound in the coming sessions.
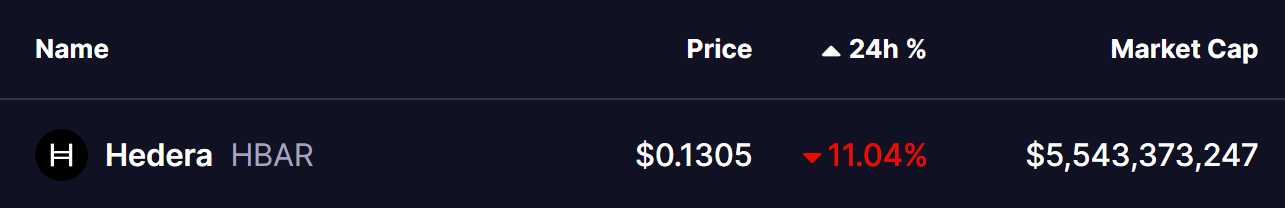 Source: Coinmarketcap
Descending Triangle in Play
On the weekly chart, HBAR has been consolidating within a descending triangle pattern — a structure that reflects tightening price movement as sellers gradually push down highs while buyers defend a horizontal demand zone. Although descending triangles are traditionally seen as bearish continuation patterns, they often produce sharp countertrend rallies when support holds strongly.
The recent drop from $0.1755 has pushed price once again into a major support zone around $0.1247. This level has acted as a crucial demand region for several months, and every test of this range has sparked a strong reaction from buyers — signaling accumulation and seller fatigue.
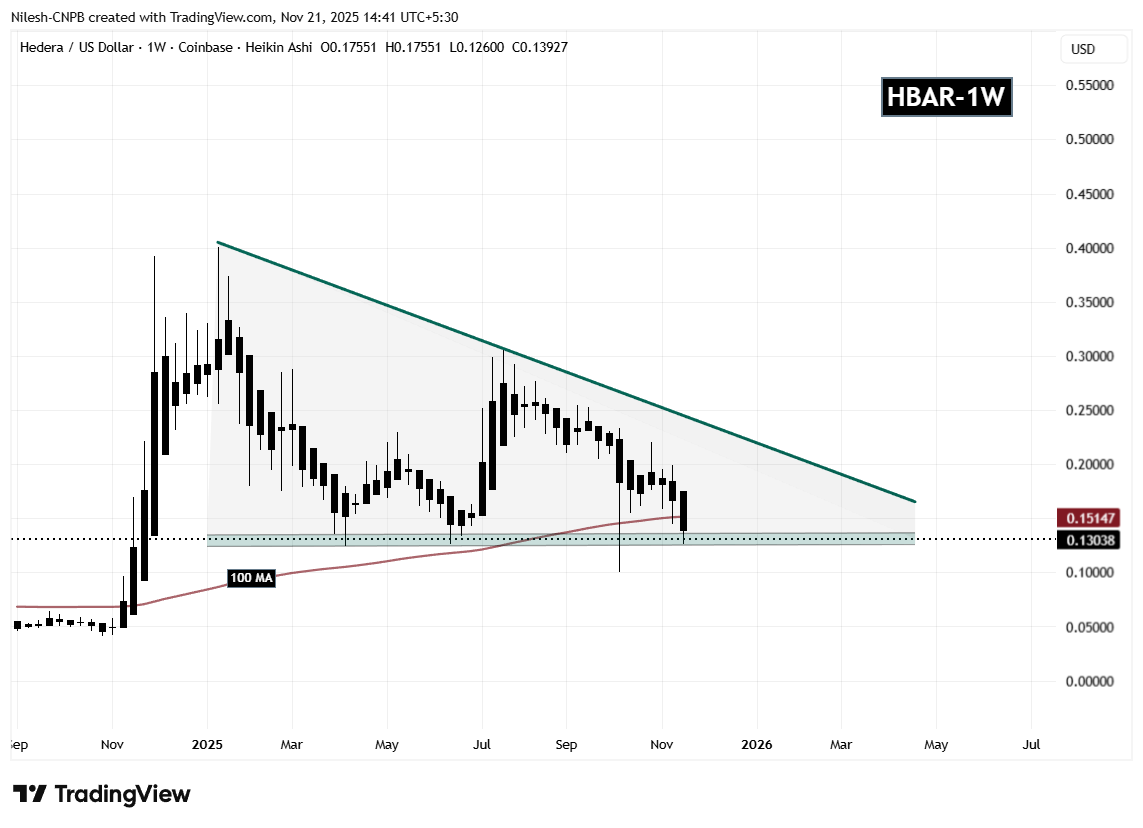 Hedera (HBAR) Weekly Chart/Coinsprobe (Source: Tradingview)
HBAR currently sits just below the 100-week moving average, which is positioned near $0.1514. A reclaim of this level would serve as a key signal that buyers are regaining control.
What’s Next for HBAR?
If bulls manage to defend the $0.1247 support range and push price back above the 100 MA, momentum could shift quickly, allowing HBAR to retest the descending trendline resistance near the $0.19 region. A breakout above this line would signal a potential trend reversal and open the door for a larger rally.
However, if support fails and price closes below the zone with volume, the descending triangle could break to the downside, exposing HBAR to deeper declines toward the $0.10 area, where the next significant support exists.
For now, the coming weekly close is critical. As long as buyers continue to defend the base of the triangle, a rebound remains a realistic scenario.