Date: Mon, Nov 17, 2025 | 11:30 AM GMT
The broader crypto market continues to face selling pressure as Ethereum (ETH) has dropped more than 17% in the past 30 days, putting significant downside weight on major altcoins , including Avalanche (AVAX).
AVAX has fallen nearly 22% over the past month, but beneath this weakness, the chart is revealing something far more constructive. A clean and well-defined harmonic structure is forming, hinting that a potential rebound could be closer than most expect.
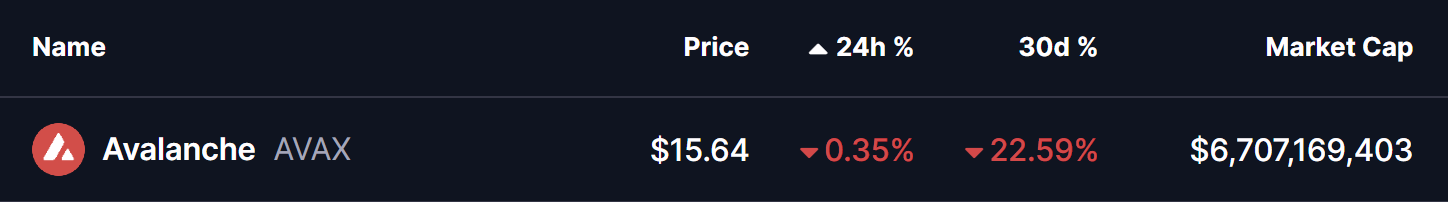 Source: Coinmarketcap
Harmonic Pattern Signals More Upside
On the 4-hour timeframe, AVAX is shaping into a Bearish Cypher harmonic pattern — a formation known for driving price higher during the CD-leg before completing at the Potential Reversal Zone (PRZ).
This structure started at Point X near $21.09, followed by a sharp correction into Point A, a recovery bounce toward Point B, and then a deeper leg lower into Point C around $14.62. From this C-point, AVAX has begun showing early signs of recovery, recently trading near $15.65 as buyers slowly step back into the market.
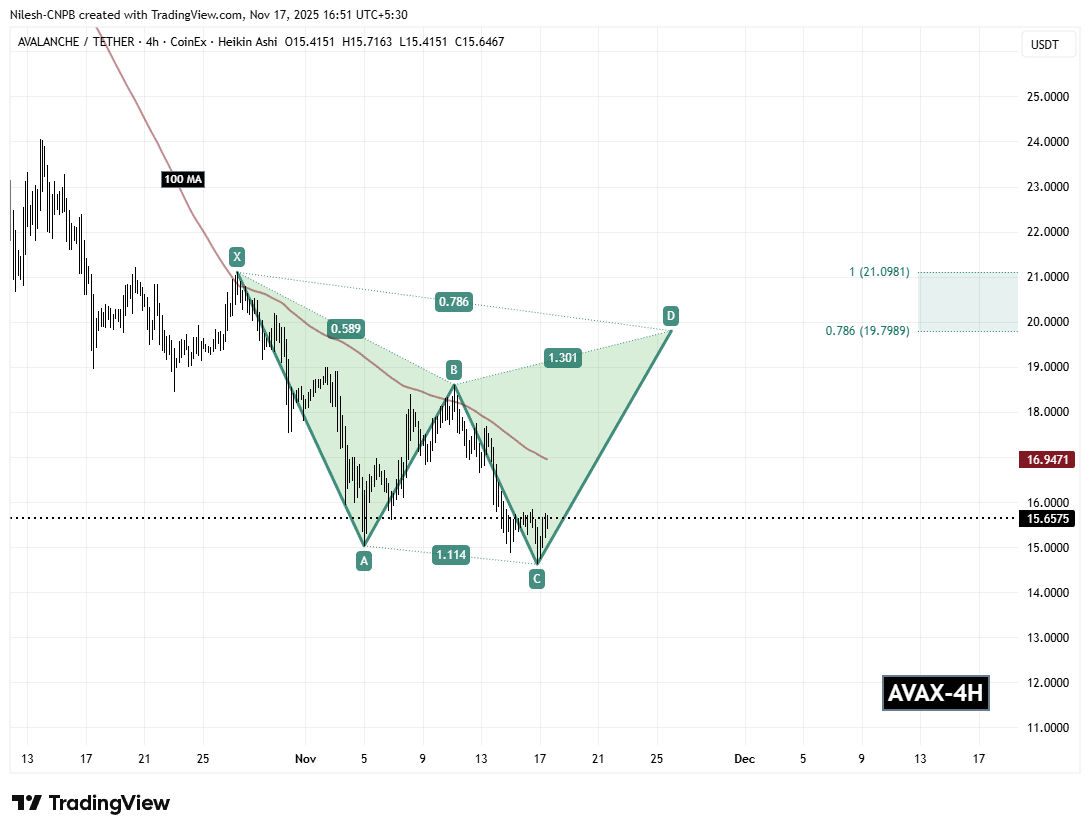 Avalanche (AVAX) 4H Chart/Coinsprobe (Source: Tradingview)
The chart also highlights a key technical factor supporting this developing move: the 100-hour moving average positioned around $16.94. This dynamic level now acts as the next major resistance and will play a crucial role in determining whether AVAX can gather enough momentum to continue its climb.
What’s Next for AVAX?
The most important level for the short term remains the C-support near $14.62. Holding above this zone keeps the harmonic pattern valid and preserves the bullish projection toward the upside.
If AVAX maintains this support and continues higher, the next major challenge will be reclaiming the 100-hour moving average. A strong breakout above $16.94 would confirm renewed confidence among buyers and likely accelerate the CD-leg toward the upper harmonic targets.
According to the Cypher pattern structure, AVAX is projected to move toward the Potential Reversal Zone (PRZ) between $19.79 (0.786 Fibonacci extension) and $21.09 (1.0 extension). This region marks the completion area of the pattern and represents a zone where the price may slow down or face stronger resistance.
However, if AVAX loses the $14.62 support, the structure weakens significantly, opening the door for further downside before any meaningful trend recovery can take place.