Ethereum Flashes a Reversal Setup — Now It Just Needs the ‘Mega’ Confirmation

Ethereum is flashing a clean reversal setup on the daily chart, but major holders are still reducing exposure. One key zone now decides whether the bullish pattern expands or fails.
Ethereum price fell nearly 11.5% over the past 24 hours. It has since recovered roughly 2.5%, now trading above $3,230. Yet, the 24-hour ticker still shows a near 6% dip.
The corrective move, however, has printed a bullish reversal pattern on the chart, but the question is whether it can play out while large holders continue to step back.
Reversal Pattern Appears, but Whale Activity Still Shows Weakness
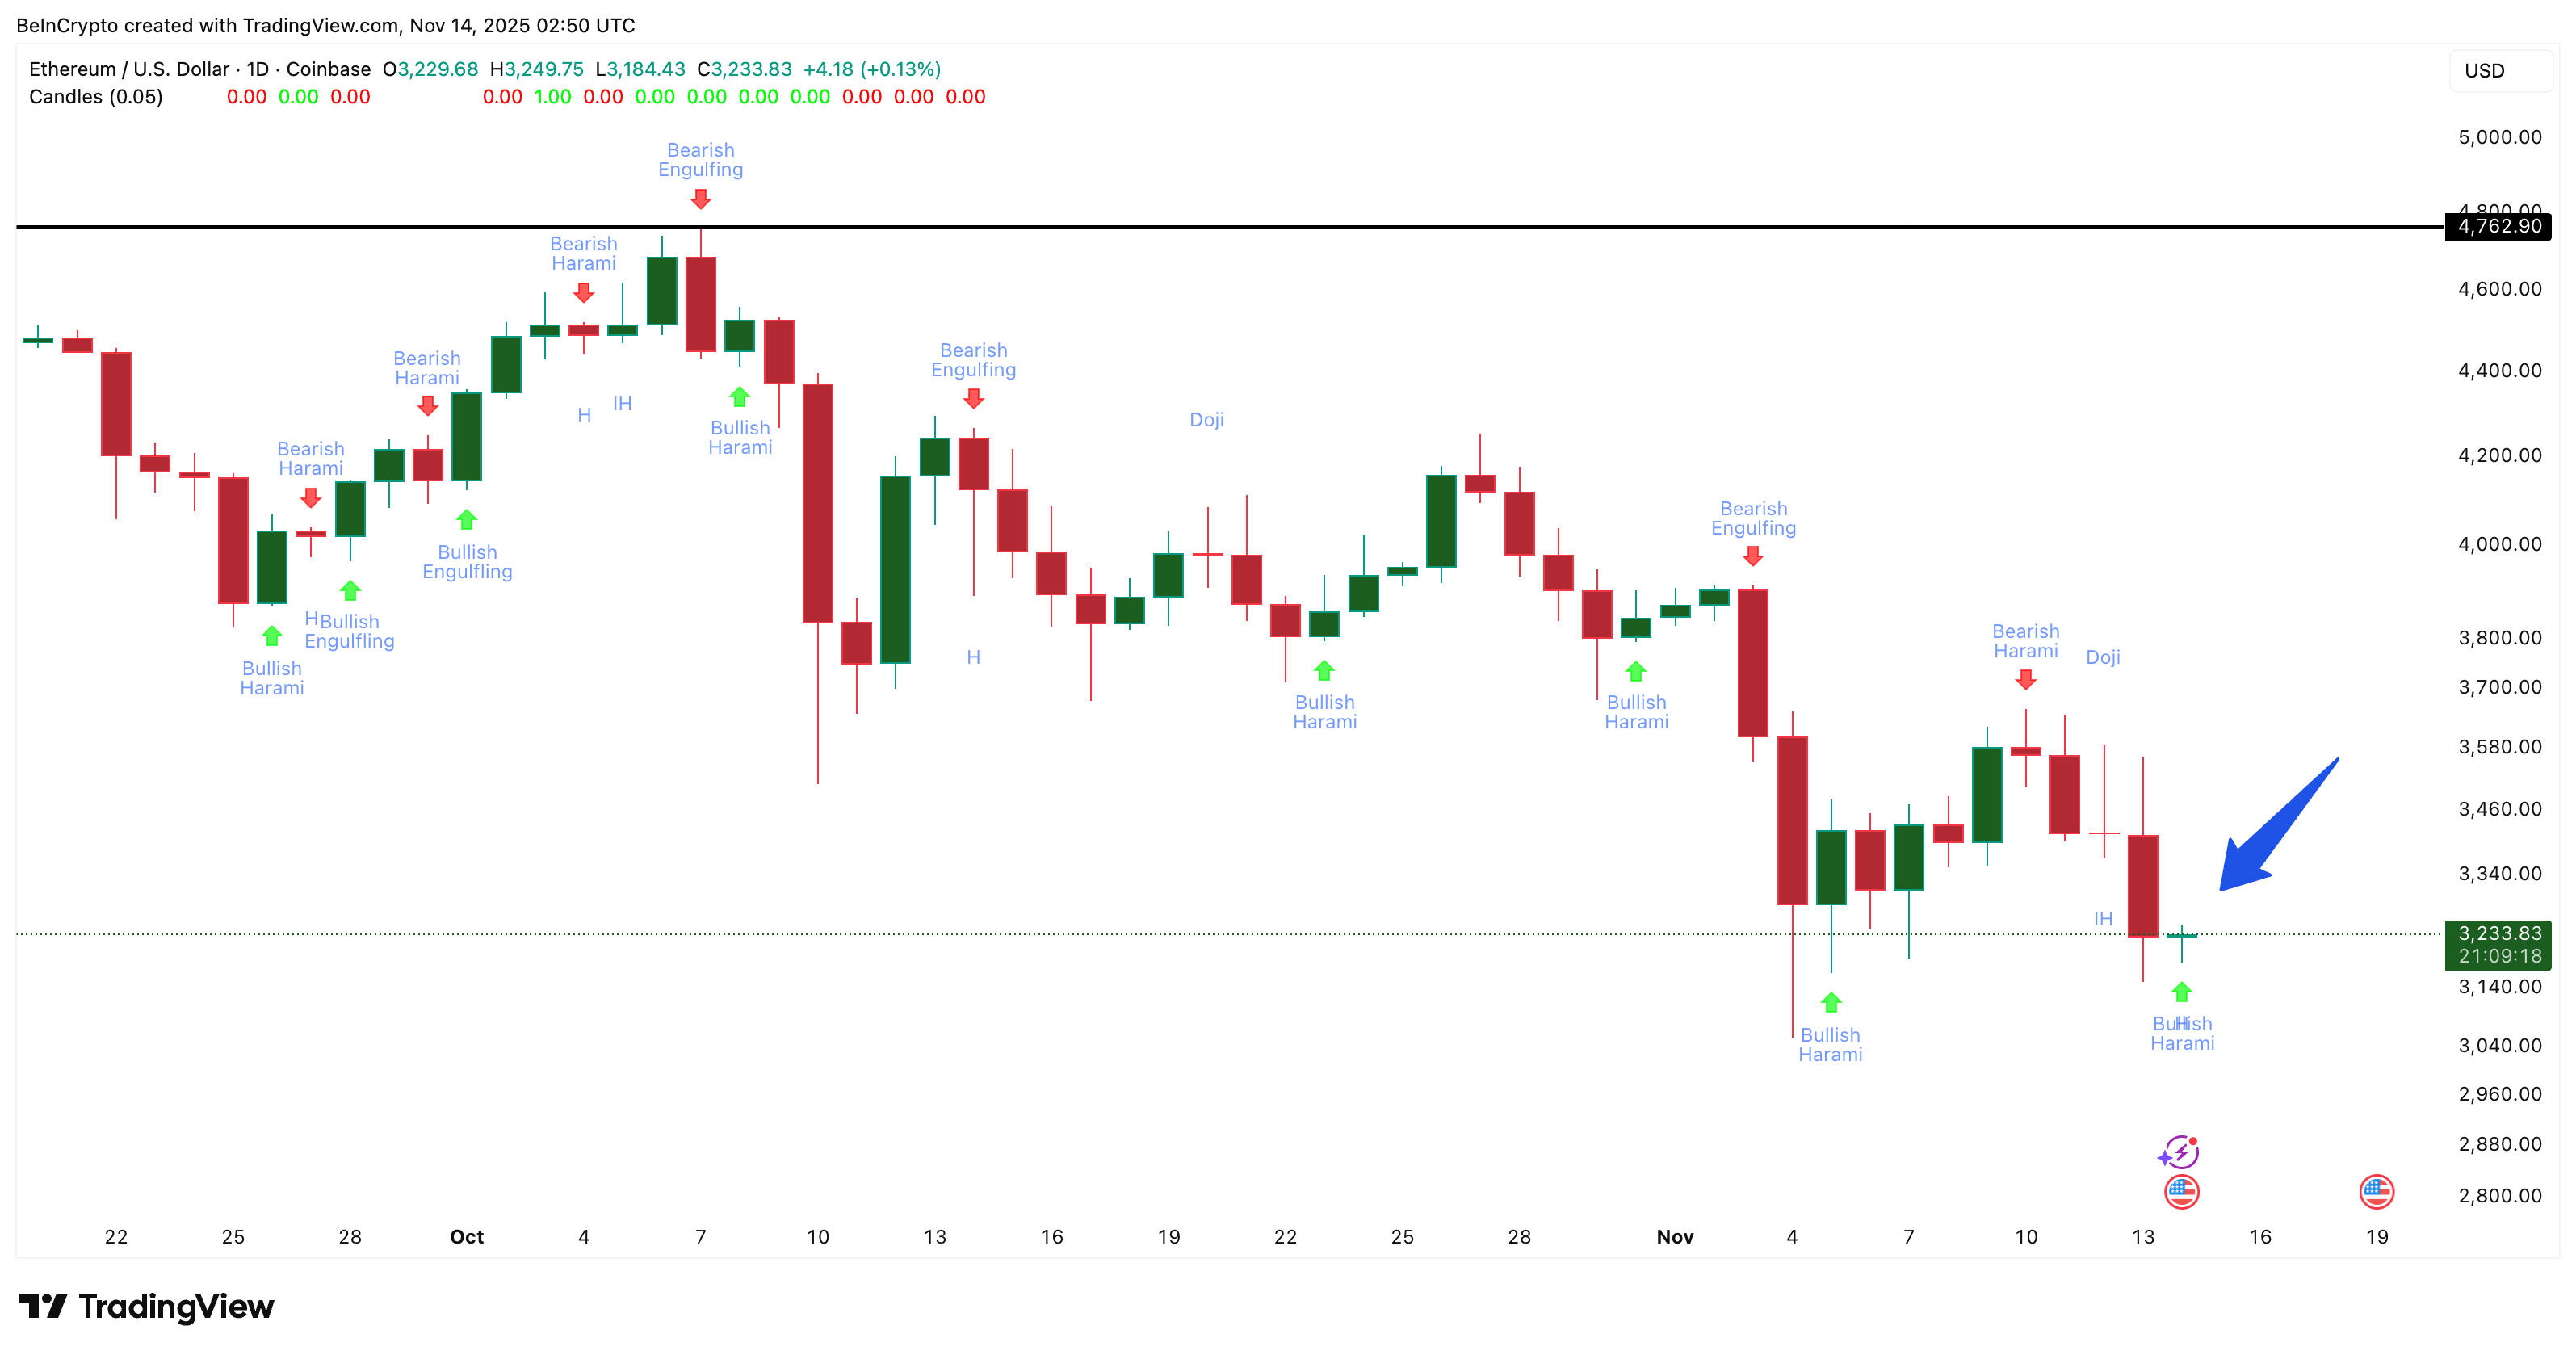
Ethereum has formed a bullish harami on the daily chart. This pattern happens when a small green candle sits inside the body of a larger red candle from the previous day. It often shows selling pressure slowing and buyers trying to regain control.
A similar setup appeared on November 5, but the bounce failed because buying strength faded quickly. That failure puts more weight on the current pattern and whether buyers can sustain momentum this time.
 Bullish Pattern Identified:
TradingView
Bullish Pattern Identified:
TradingView
Want more token insights like this? Sign up for Editor Harsh Notariya’s Daily Crypto Newsletter
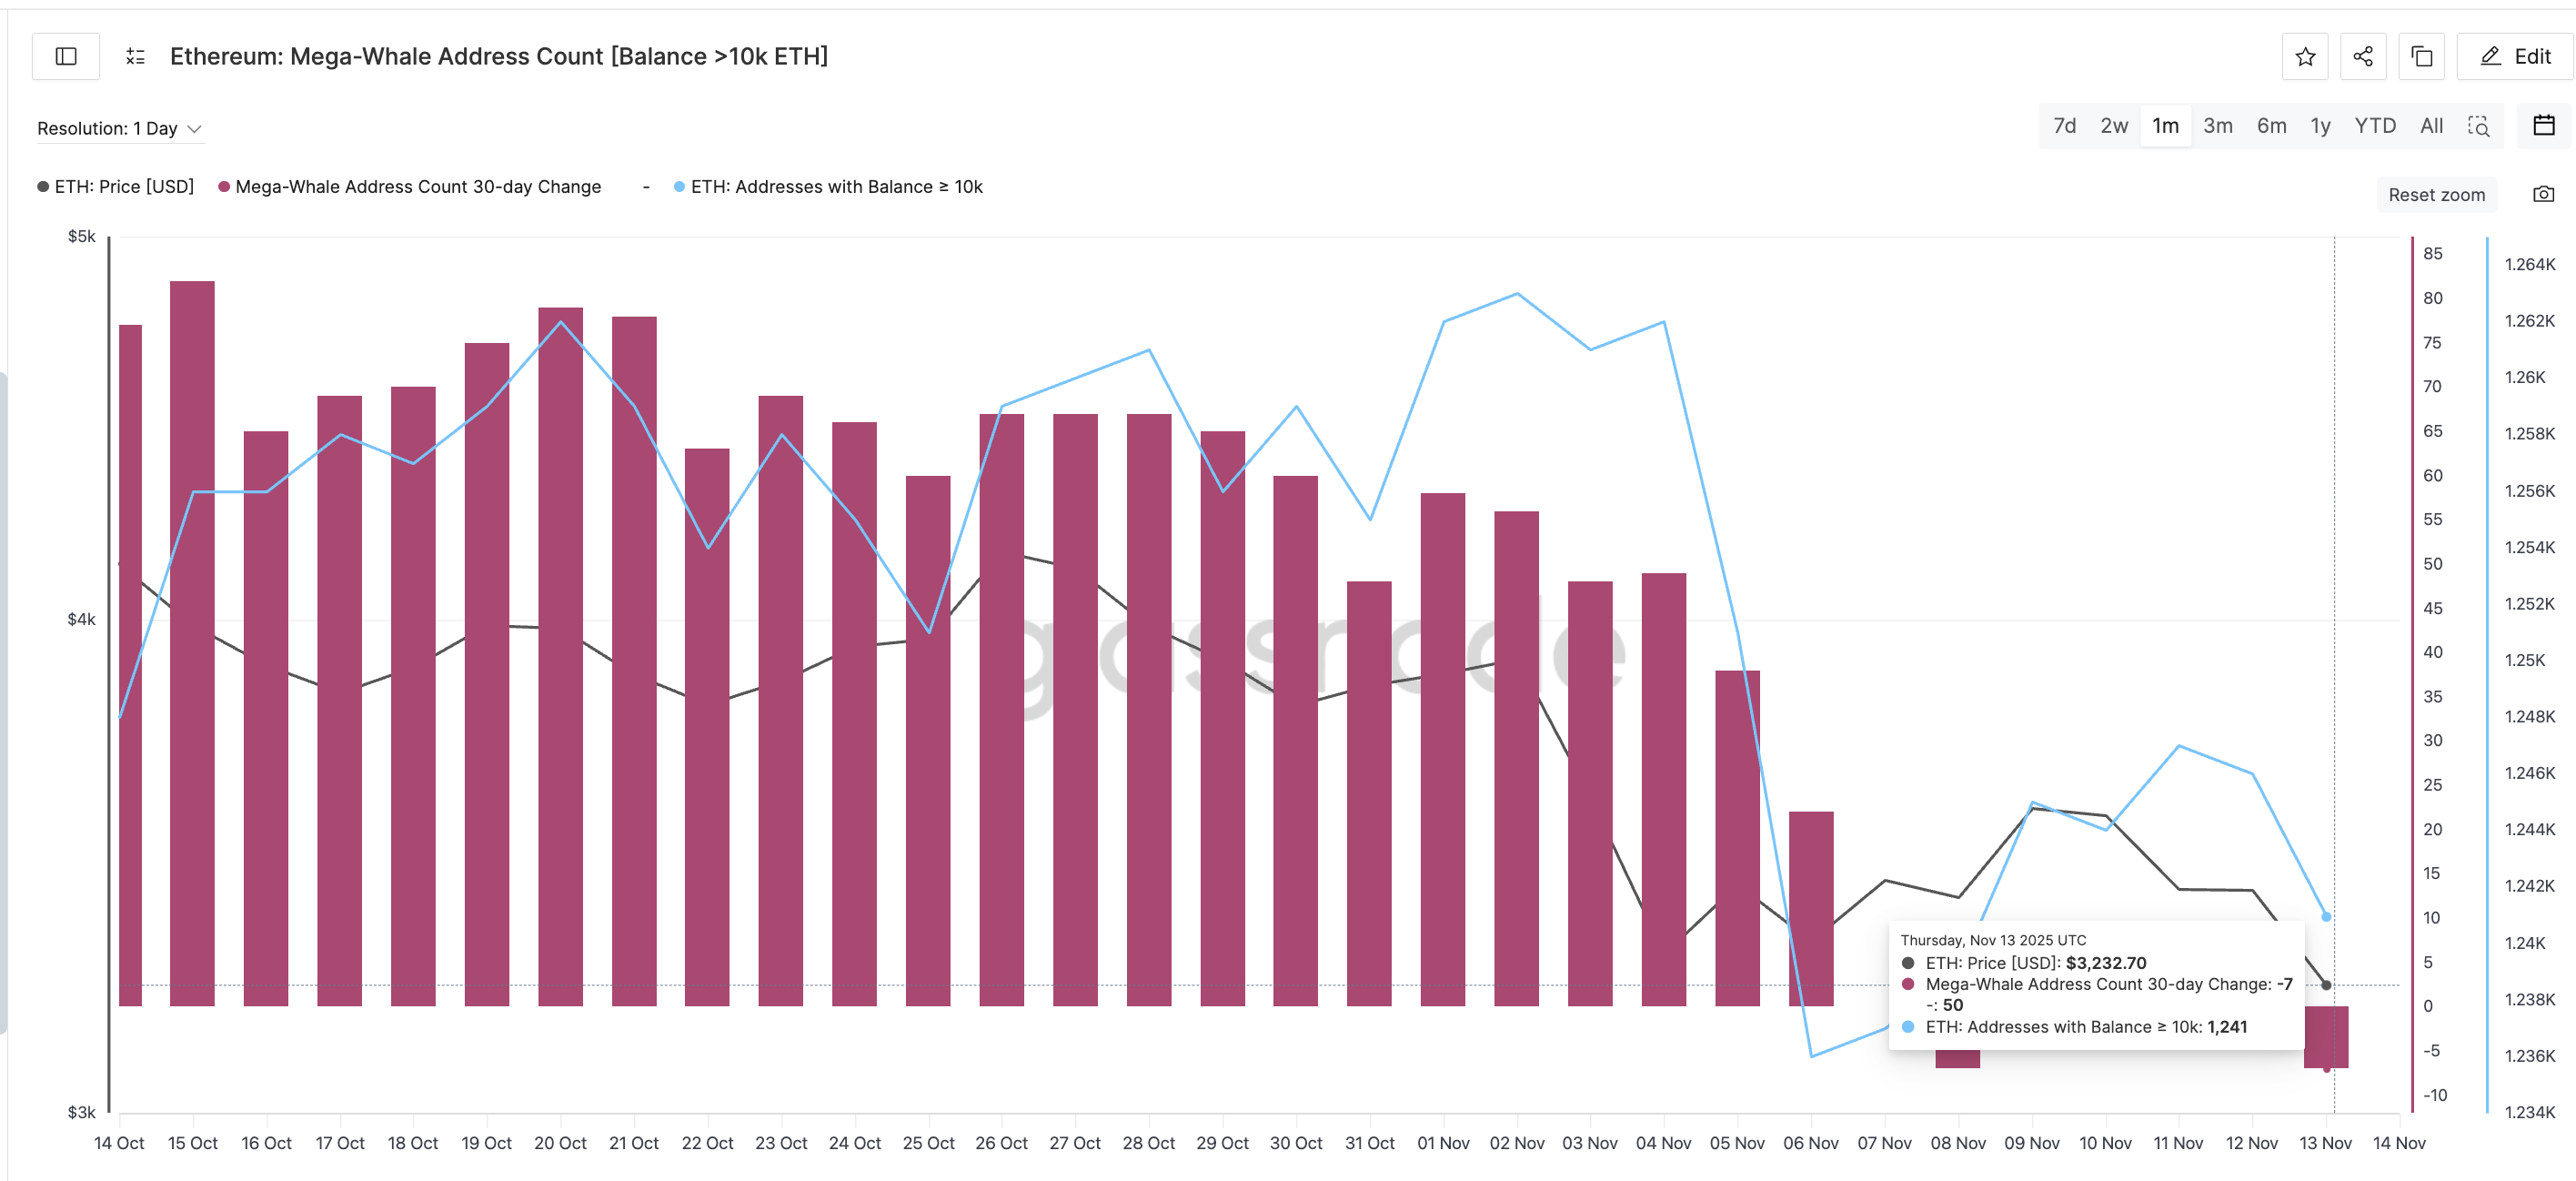
The pressure comes from whale behavior. The mega-whale address count, which tracks the 30-day change in wallets holding over 10,000 ETH, has dropped again. It is now back to the same negative level seen on November 8.
The number of addresses holding 10k ETH has also been falling since November 2. There was a small pickup from November 6 to 11 during a short-lived rebound, but the decline returned immediately after. That decline in holdings coincided with Ethereum’s bearish crossover, a risk we highlighted earlier.
 Mega ETH Whales Not Convinced:
Glassnode
Mega ETH Whales Not Convinced:
Glassnode
So even though the bullish harami is active, whales are not supporting the move yet. That keeps the Ethereum price reversal setup weaker than it looks on the chart.
Key Levels Now Decide Whether the Ethereum Price Reversal Expands or Fades
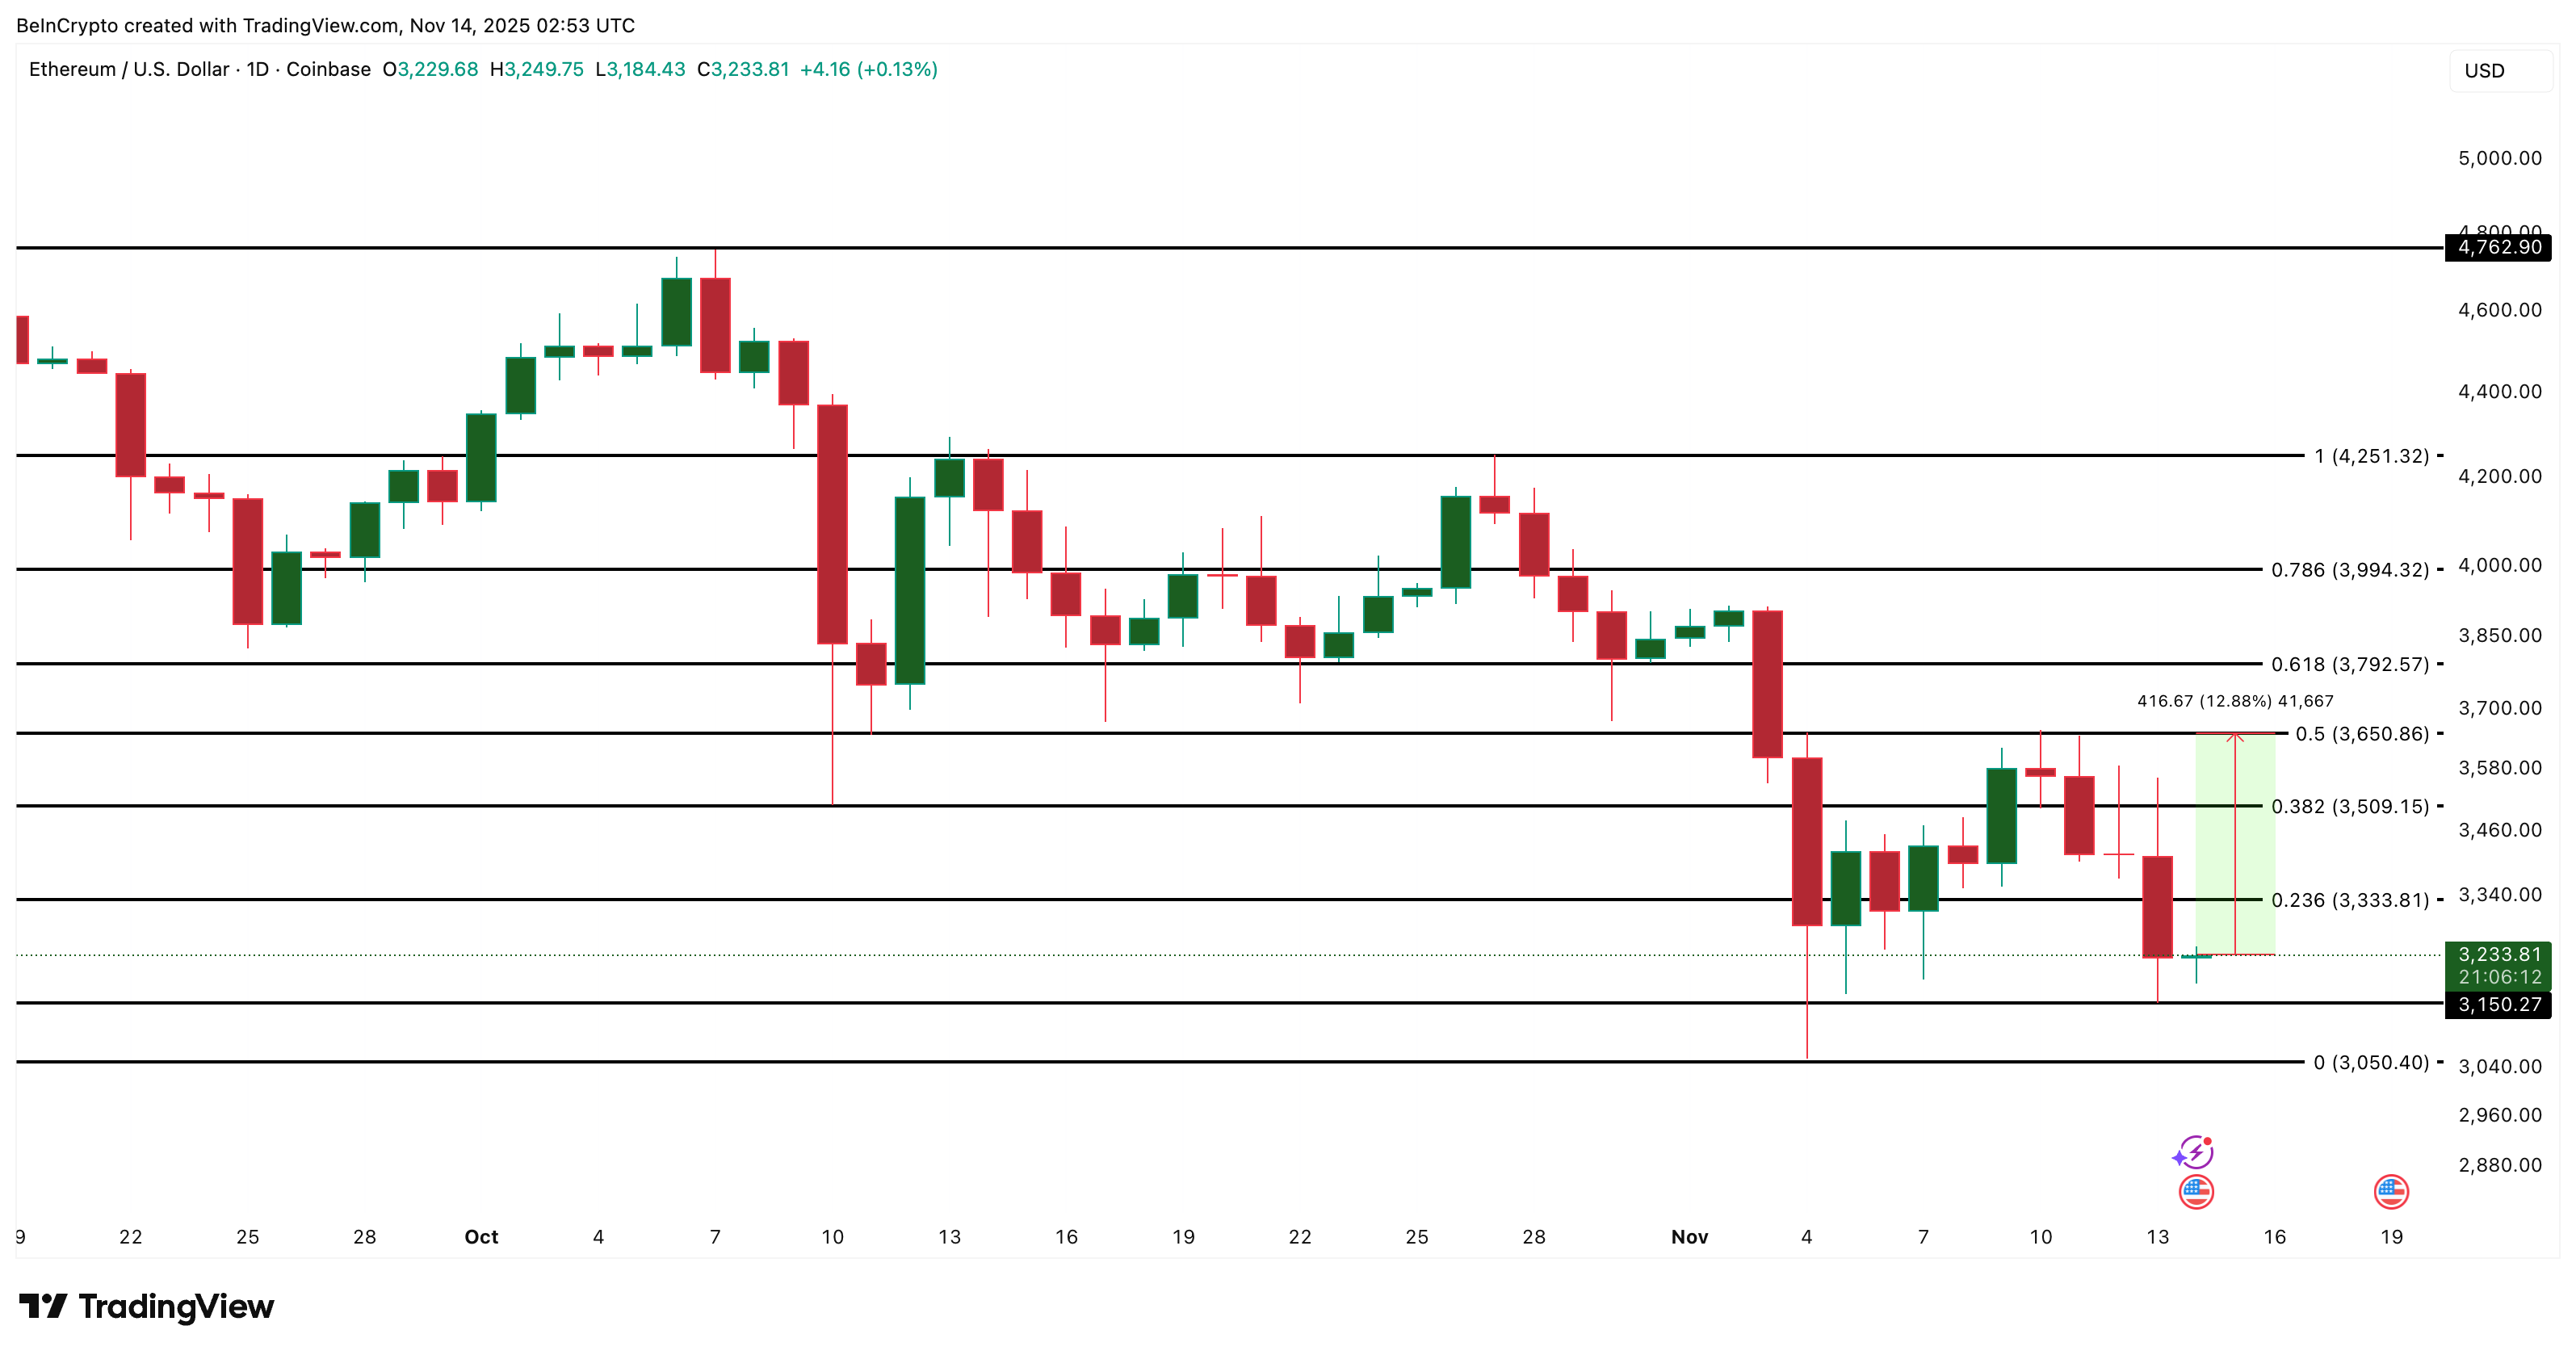
If the bullish pattern holds, Ethereum’s next test sits near $3,333, a short-term level that has limited rebounds this week. That level is mentioned later when we discuss the Ethereum price chart.
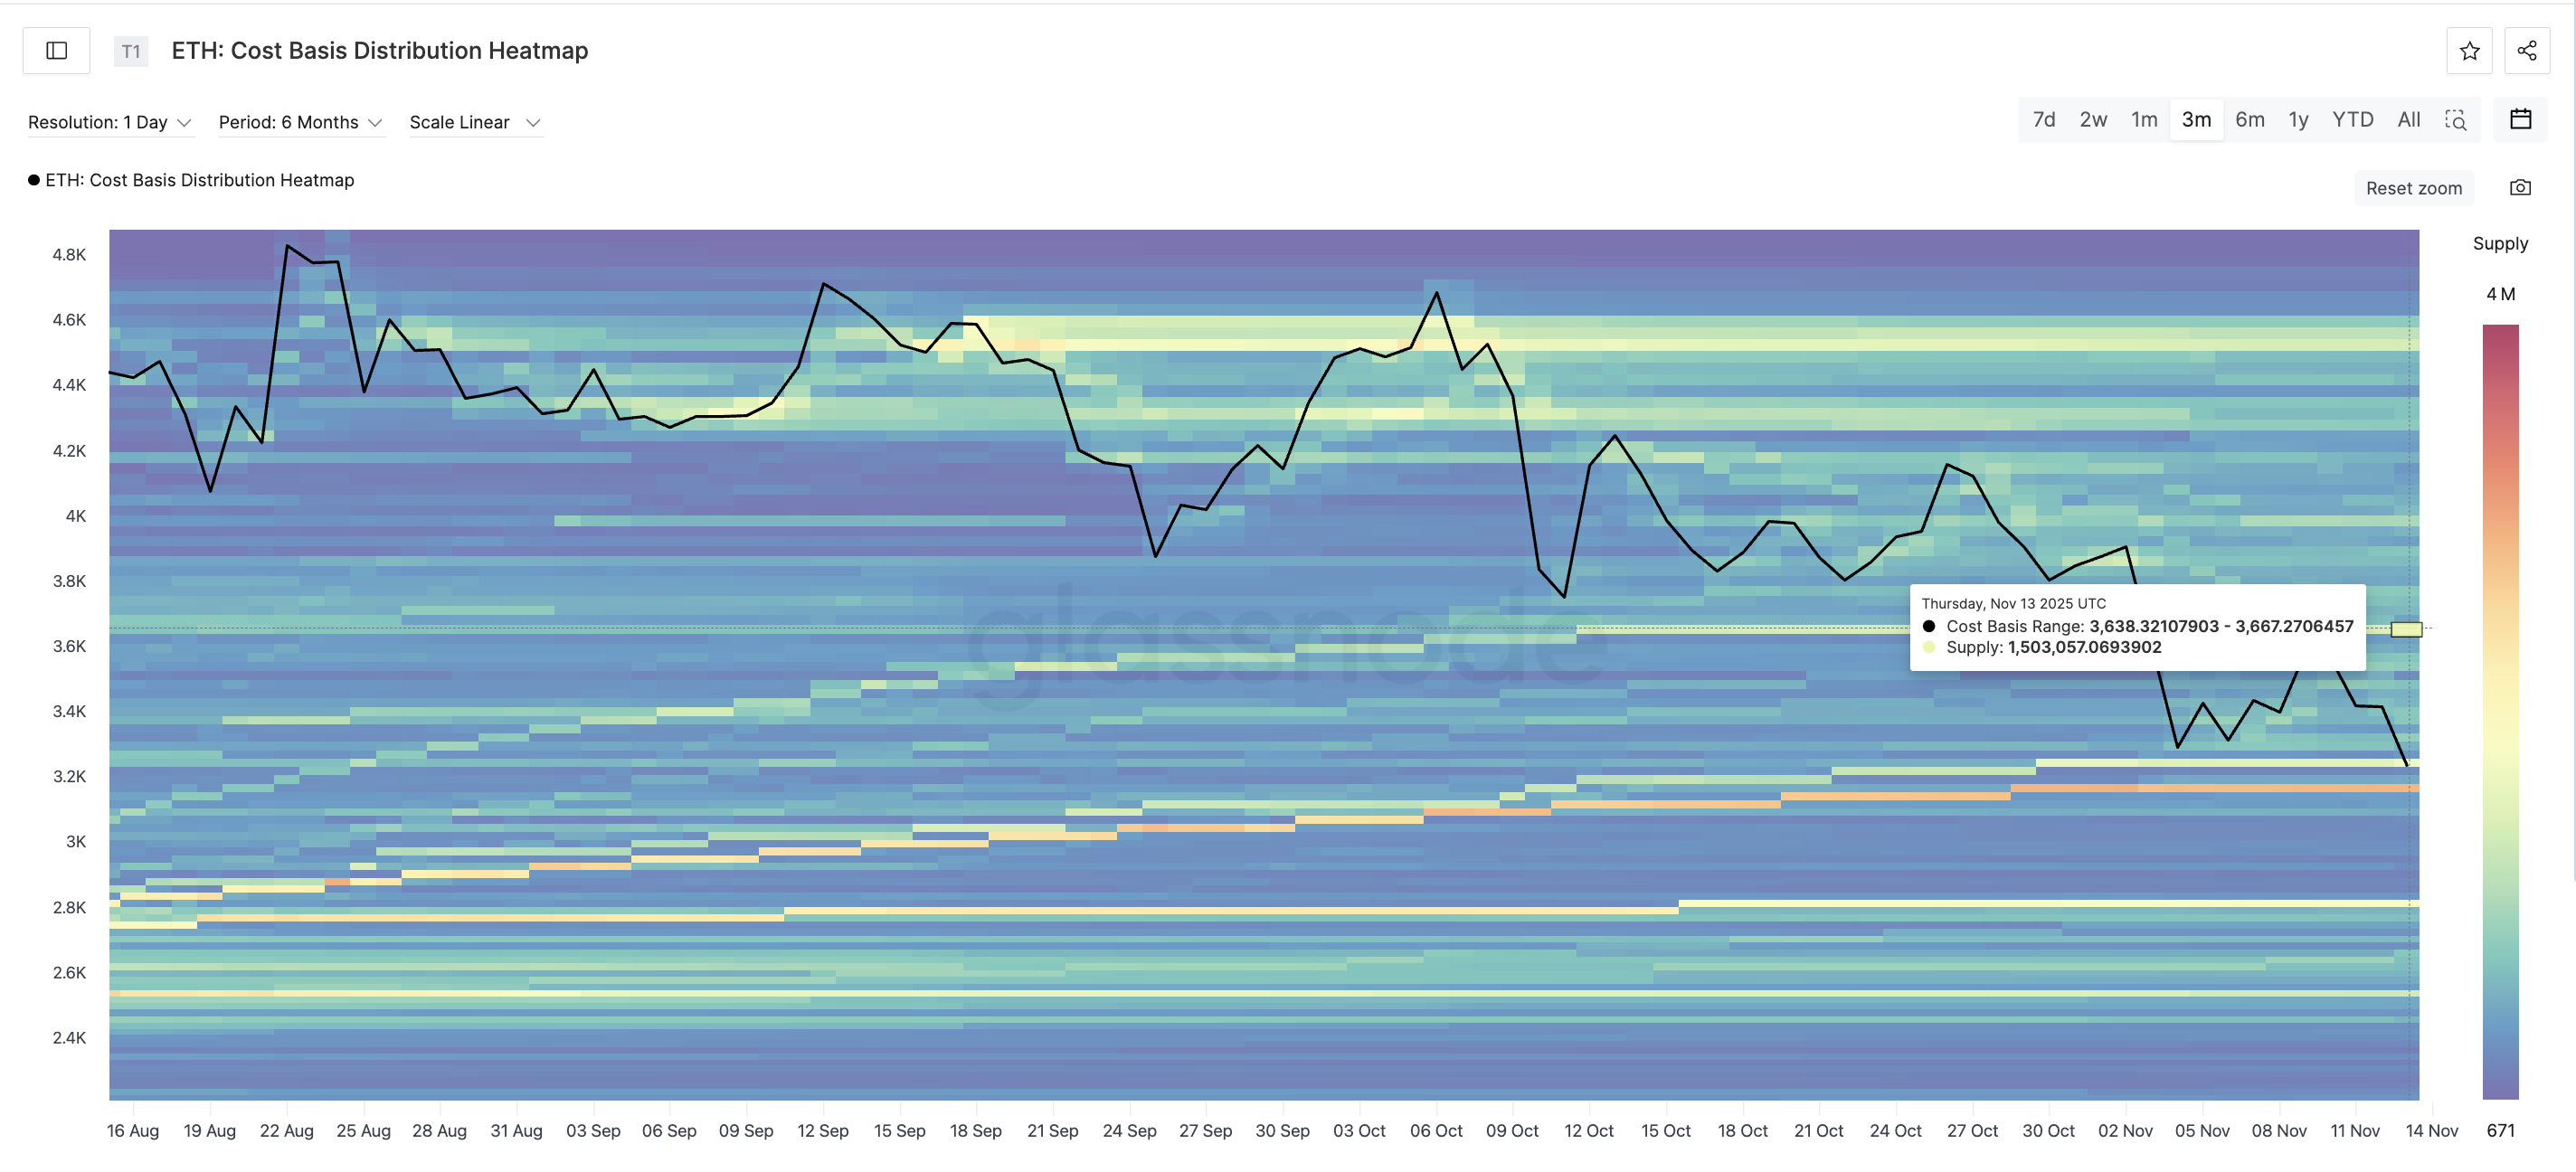
The stronger hurdle is $3,650, which requires a 12% move from the recent low. Data from the cost-basis distribution heatmap, a tool that maps where large amounts of ETH last changed hands, shows that $3,638–$3,667 holds one of the biggest supply zones.
 Ethereum Supply Cluster:
Glassnode
Ethereum Supply Cluster:
Glassnode
It contains more than 1.5 million ETH, so clearing it would show strong buyer commitment. This is why the $3,650 level becomes all the more important.
A close above this band would confirm that the bullish harami is working and could open a broader recovery. But if the Ethereum price loses support near $3,150, the pattern weakens fast.
 Ethereum Price Analysis:
TradingView
Ethereum Price Analysis:
TradingView
A sharp drop below $3,050 would invalidate the structure and allow sellers to push lower, repeating what happened after the failed harami earlier this month.
Disclaimer: The content of this article solely reflects the author's opinion and does not represent the platform in any capacity. This article is not intended to serve as a reference for making investment decisions.
You may also like
Bitcoin News Update: Crypto Market Finds "Fertile Ground" Post-Drop as Buyers Take in Capitulation Sales
- Bitcoin fell below $95,000 in late November 2025, triggering panic as the Fear & Greed Index hit a nine-month low of 10. - Waning institutional demand, macroeconomic uncertainty, and $600M in forced liquidations accelerated the selloff, with spot ETFs losing $1.1B in outflows. - XWIN Research warned the correction could persist until mid-2026 if key $92,000–$94,000 support levels fail, while 96 of top 100 cryptos declined. - Political tensions emerged after Trump pardoned Binance's Zhao, who received a $
Bitcoin News Update: "Institutions' Confidence or Meme Frenzy: Crypto Faces the $110,000 Turning Point"
- Bitcoin rebounds from $100k lows amid U.S. government reopening, with analysts eyeing $110k as potential target driven by regulatory clarity and ETF optimism. - MoonBull ($MOBU) emerges as high-risk speculative play, projecting 7,244% ROI through Ethereum-based tokenomics including liquidity locks and 2% holder reflections. - Market duality highlighted by institutional-grade BTC consolidation vs. community-driven meme tokens, with $MOBU's 23-stage presale raising $600k and 1,900+ holders. - Technical ind

Ethereum News Update: Ethereum’s Unsteady Recovery: Weighing Optimism Against Ongoing Downward Pressures
- Ethereum rose 2.36% to $3,533 on Nov 13, 2025, with $37B trading volume, showing a rebound from $3,373 lows amid crypto market volatility. - Technical analysis warns of fragile recovery, with key support at $3,053 holding but bearish signals from MACD and a broken upward channel. - Broader crypto pressure persists as Bitcoin and Ethereum ETFs face outflows, while macroeconomic uncertainties like U.S. government shutdown risks dampen institutional participation. - Analysts advise caution below the 200-day
Uniswap News Today: Uniswap's UNIfication Launches a New Era of DeFi Leadership for the Next Decade
- Uniswap's UNIfication proposal introduces protocol fees, token burns, and buybacks to transform UNI into a deflationary asset. - The plan drives UNI's 63% weekly price surge and allocates 0.3% trading volume to liquidity providers and buybacks. - Whale accumulation and $38M/month buyback projections signal strong market confidence in Uniswap's governance overhaul. - The proposal unifies Uniswap's ecosystem, introduces fee discounts, and launches CCA for institutional-grade liquidity infrastructure. - DeF