
YFI Price Climbs 3.05% as Recent Gains Counteract Yearly Downtrend
- YFI surged 3.05% in 24 hours, with short-term gains offsetting a 38.46% annual decline. - Technical analysis highlights a key resistance breakout, potentially boosting buying interest despite remaining below 52-week highs. - A backtesting strategy tests long positions after 5% daily surges, evaluating profitability and risk over 2022-2025 market cycles. - Metrics like total return and win/loss ratio will assess strategy viability against buy-and-hold benchmarks.
As of November 13, 2025,
Although YFI has dropped 38.46% year-over-year, it has recently shown some positive momentum, with a 4.49% rise in the last month and a 1.05% uptick over the previous week. These short-term advances may indicate a possible brief reversal, but the longer-term downward trend is still present. The 3.05% jump in the last 24 hours highlights this recent strength, but experts warn that overall market trends and investor attitudes will play a crucial role in whether this upward movement can be sustained.
From a technical standpoint, YFI has recently surpassed an important resistance point, which could encourage additional buying activity. Nevertheless, the asset remains far below its highest price in the past year and has not yet demonstrated a lasting recovery from its 38.46% annual decline. Traders are monitoring closely to see if this recent rally will persist or if it is simply a temporary rebound within a broader bearish market.
Backtest Hypothesis
To evaluate the effectiveness of a trading approach based on YFI’s latest price behavior, an event-driven backtesting method is suggested. This test would model a strategy where a long position is taken in YFI after a single-day price increase of 5%, holding the position for five trading sessions, and closing it either at the end of the fifth day or if a 3% stop-loss is triggered. This setup enables analysis of how similar price surges have performed historically and assesses the potential risks and rewards of the strategy.
The backtest would cover the period from January 1, 2022, to November 13, 2025, encompassing both rising and falling markets. The entry condition is a daily return of at least 5% from close to close, with the purchase made at the opening of the next session. This approach ensures consistent execution and minimizes the impact of intraday sentiment swings. A 3% trailing stop-loss would be implemented to manage potential losses if the trade moves unfavorably.
Backtest results would report figures such as overall return, average profit or loss per trade, largest drawdown, and the ratio of winning to losing trades. These statistics would help identify if the strategy is more appropriate for conservative or aggressive investors. The analysis would also compare this approach to a simple buy-and-hold strategy to evaluate its relative effectiveness.
Disclaimer: The content of this article solely reflects the author's opinion and does not represent the platform in any capacity. This article is not intended to serve as a reference for making investment decisions.
You may also like
Ripple Commits $4B to Build Crypto’s Bridge to Wall Street
Bitcoin price risks deeper losses as Nasdaq correlation turns one-sided: Wintermute
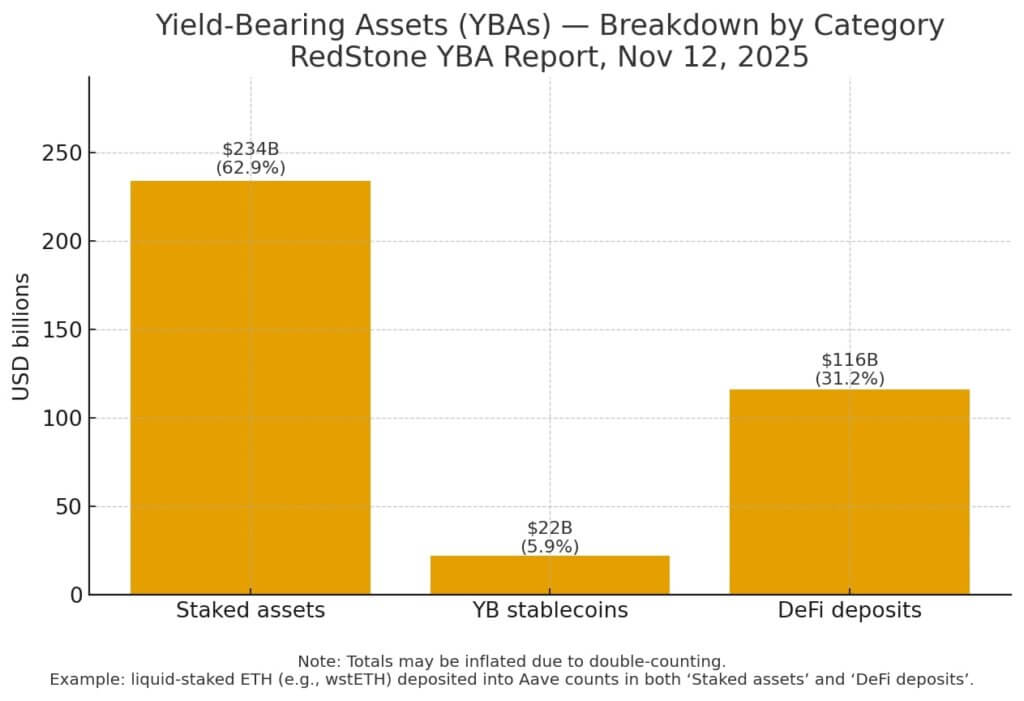
Only 10% of crypto earns yield now — why most investors are sitting on dead money
US President Donald Trump Signs 43-Day-Long Plan! The White House Makes Important Statement That the Fed Won't Like!