- SUI trades near $2.02, forming a base structure that could spark a rally toward $2.50 resistance.
- The chart shows tightening volatility, suggesting consolidation before a potential momentum-driven breakout.
- Analysts highlight $2.02 as a decisive support zone that may define the next directional trend in the token.
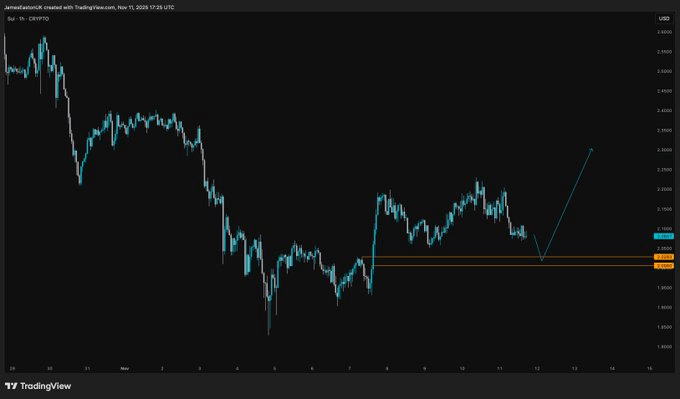
SUI is showing signs of forming a strong bullish setup, with price action stabilizing around critical support near $2.02–$2.06. A chart shared by analyst James Easton on November 11 revealed potential for a sharp rebound if momentum builds from this zone. The analyst described the setup as “potentially a very nice one” and added that if the move sustains, upcoming rallies could be “violent.”
 Source:
SUI
Source:
SUI
The chart displays a defined horizontal base at $2.02, marking a region where previous reactions triggered strong reversals. Price behavior over recent sessions has shown reduced volatility, suggesting a consolidation phase that could precede an upward expansion. The projected structure points to a likely breakout scenario if SUI maintains its support and attracts renewed buying pressure.
Market watchers interpret this pattern as an early accumulation stage, with traders preparing for a potential mid-term bullish wave. SUI’s setup also aligns with broader market recovery signs observed across select large-cap altcoins in recent trading sessions.
SUI’s Technical Picture Highlights a Key Turning Point
The one-hour chart pattern shows a distinct “V-shaped” rebound projection following the current consolidation. The lower wick around $2.02 has been tested multiple times, reinforcing its status as a short-term liquidity zone. If price maintains above this level, a continuation toward the $2.40–$2.50 range could follow, based on historical swing projections.
Analyst commentary suggests that sustained rallies from this range often evolve into momentum-driven expansions, fueled by traders entering at discounted positions. The narrow structure of recent candles indicates a tightening range—a condition that frequently precedes breakout volatility. SUI’s ability to establish higher lows over the next few sessions will be pivotal in confirming this thesis.
Historically, similar setups in the SUI’s price structure have led to pronounced rallies within short periods once key supports are held. The chart implies that the next move could define whether transitions from short-term consolidation to renewed bullish acceleration.
Traders Monitor Reaction Around $2.02 Support Zone
SUI’s $2.02–$2.06 range remains the focal point for short-term traders as they monitor for confirmation of a base formation. If demand continues to absorb sell orders at this level, it may trigger a sharp breakout, potentially revisiting SUI’s highs near $2.50. Such a move would represent a near 20% recovery from current levels, aligning with past rebound metrics.
Easton’s update emphasizes that SUI’s monitoring volume behavior around this key support will determine the strength of the potential breakout. Market participants have shown growing interest in its price structure, given its tendency to rally sharply following prolonged pullbacks.