Mega Whales Keep ASTER’s All-Time High Hopes Alive — If It Clears $2.27

ASTER price action is flashing strength even as exchange flows rise. Mega whales are adding, indicators stay firm, and one key level could decide whether ASTER charts a new all-time high soon.
ASTER’s recent listing on Binance has pulled the token back into the spotlight. While the ASTER price briefly cooled to under $2 after strong gains, large-holder activity and strengthening indicators suggest the story is far from over.
The short-term data points to a tug-of-war between liquidity positioning and genuine selling, but if the bulls are right, leaving ASTER now might not be the best decision ever. More so as it’s mere 17% south of its recent all-time high.
Mega Whales Accumulate
On-chain data shows ASTER’s biggest holders are quietly strengthening their grip.
The top 100 addresses — or “mega whales” — now hold about 7.84 billion ASTER, up 1.76% in 24 hours. That’s roughly 134 million ASTER, worth around $264 million at current prices.
Meanwhile, public-figure wallets have also grown their holdings by 5.34%, adding about 236,000 ASTER (almost $465,000).
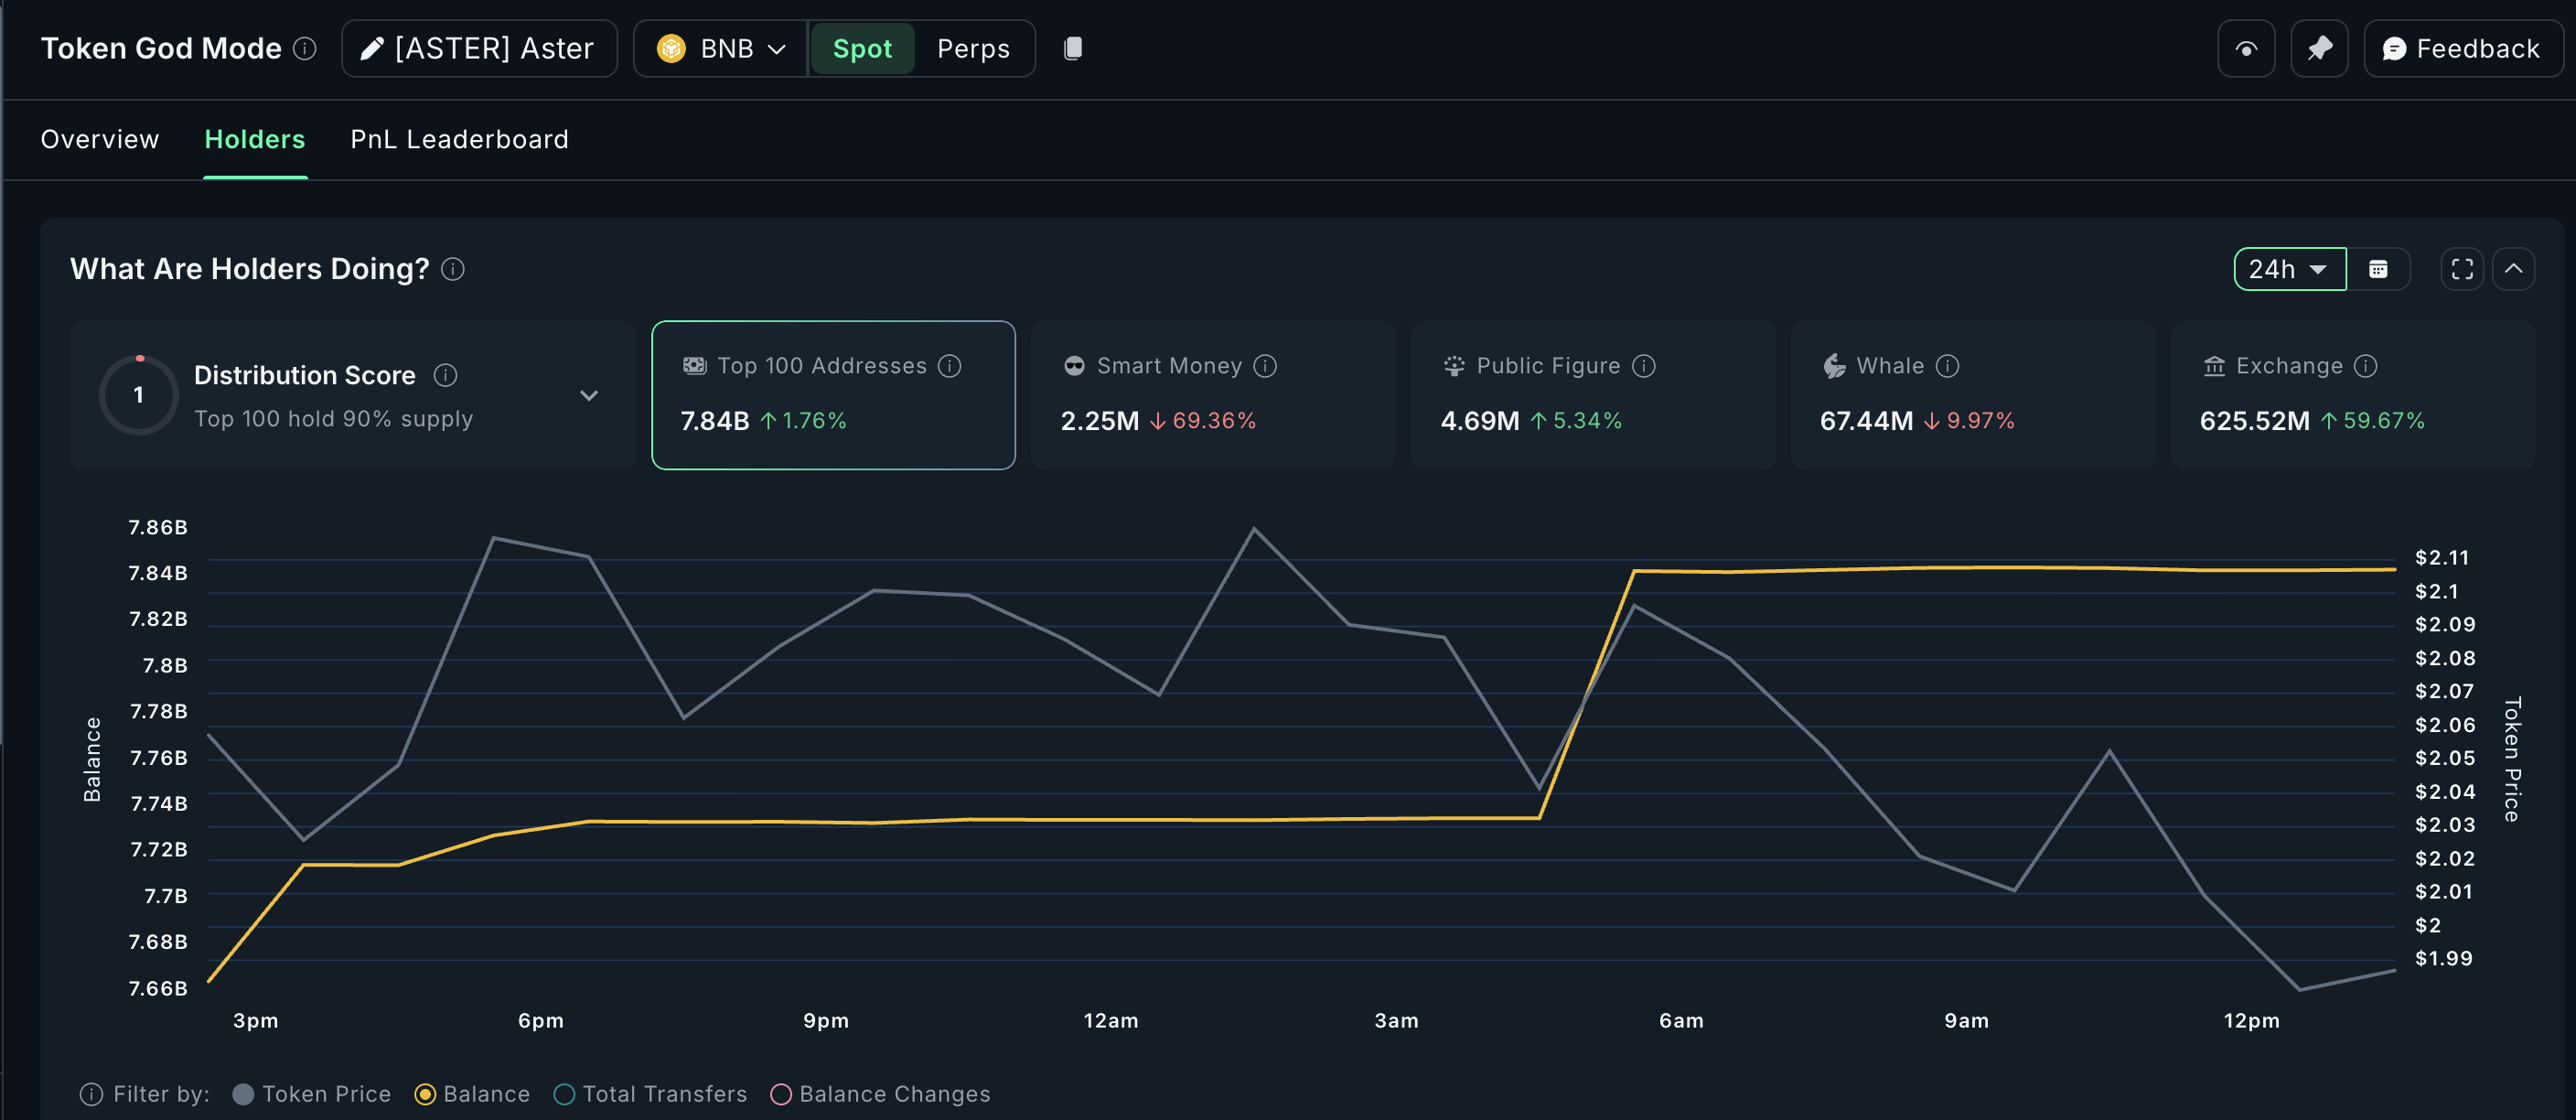 ASTER Holding Pattern:
In contrast, smart-money wallets reduced exposure by nearly 70%, while whales trimmed holdings by 9.97%, selling about 7.5 million ASTER ( close to $15 million).
Exchange balances have surged 59.6% to 625 million ASTER, which could look like heavy selling — but that might be misleading. Given Binance’s new listing, part of this jump could be liquidity repositioning.
Supporting that, the Money Flow Index (MFI) — which measures buying and selling pressure based on price and volume — is trending upward.
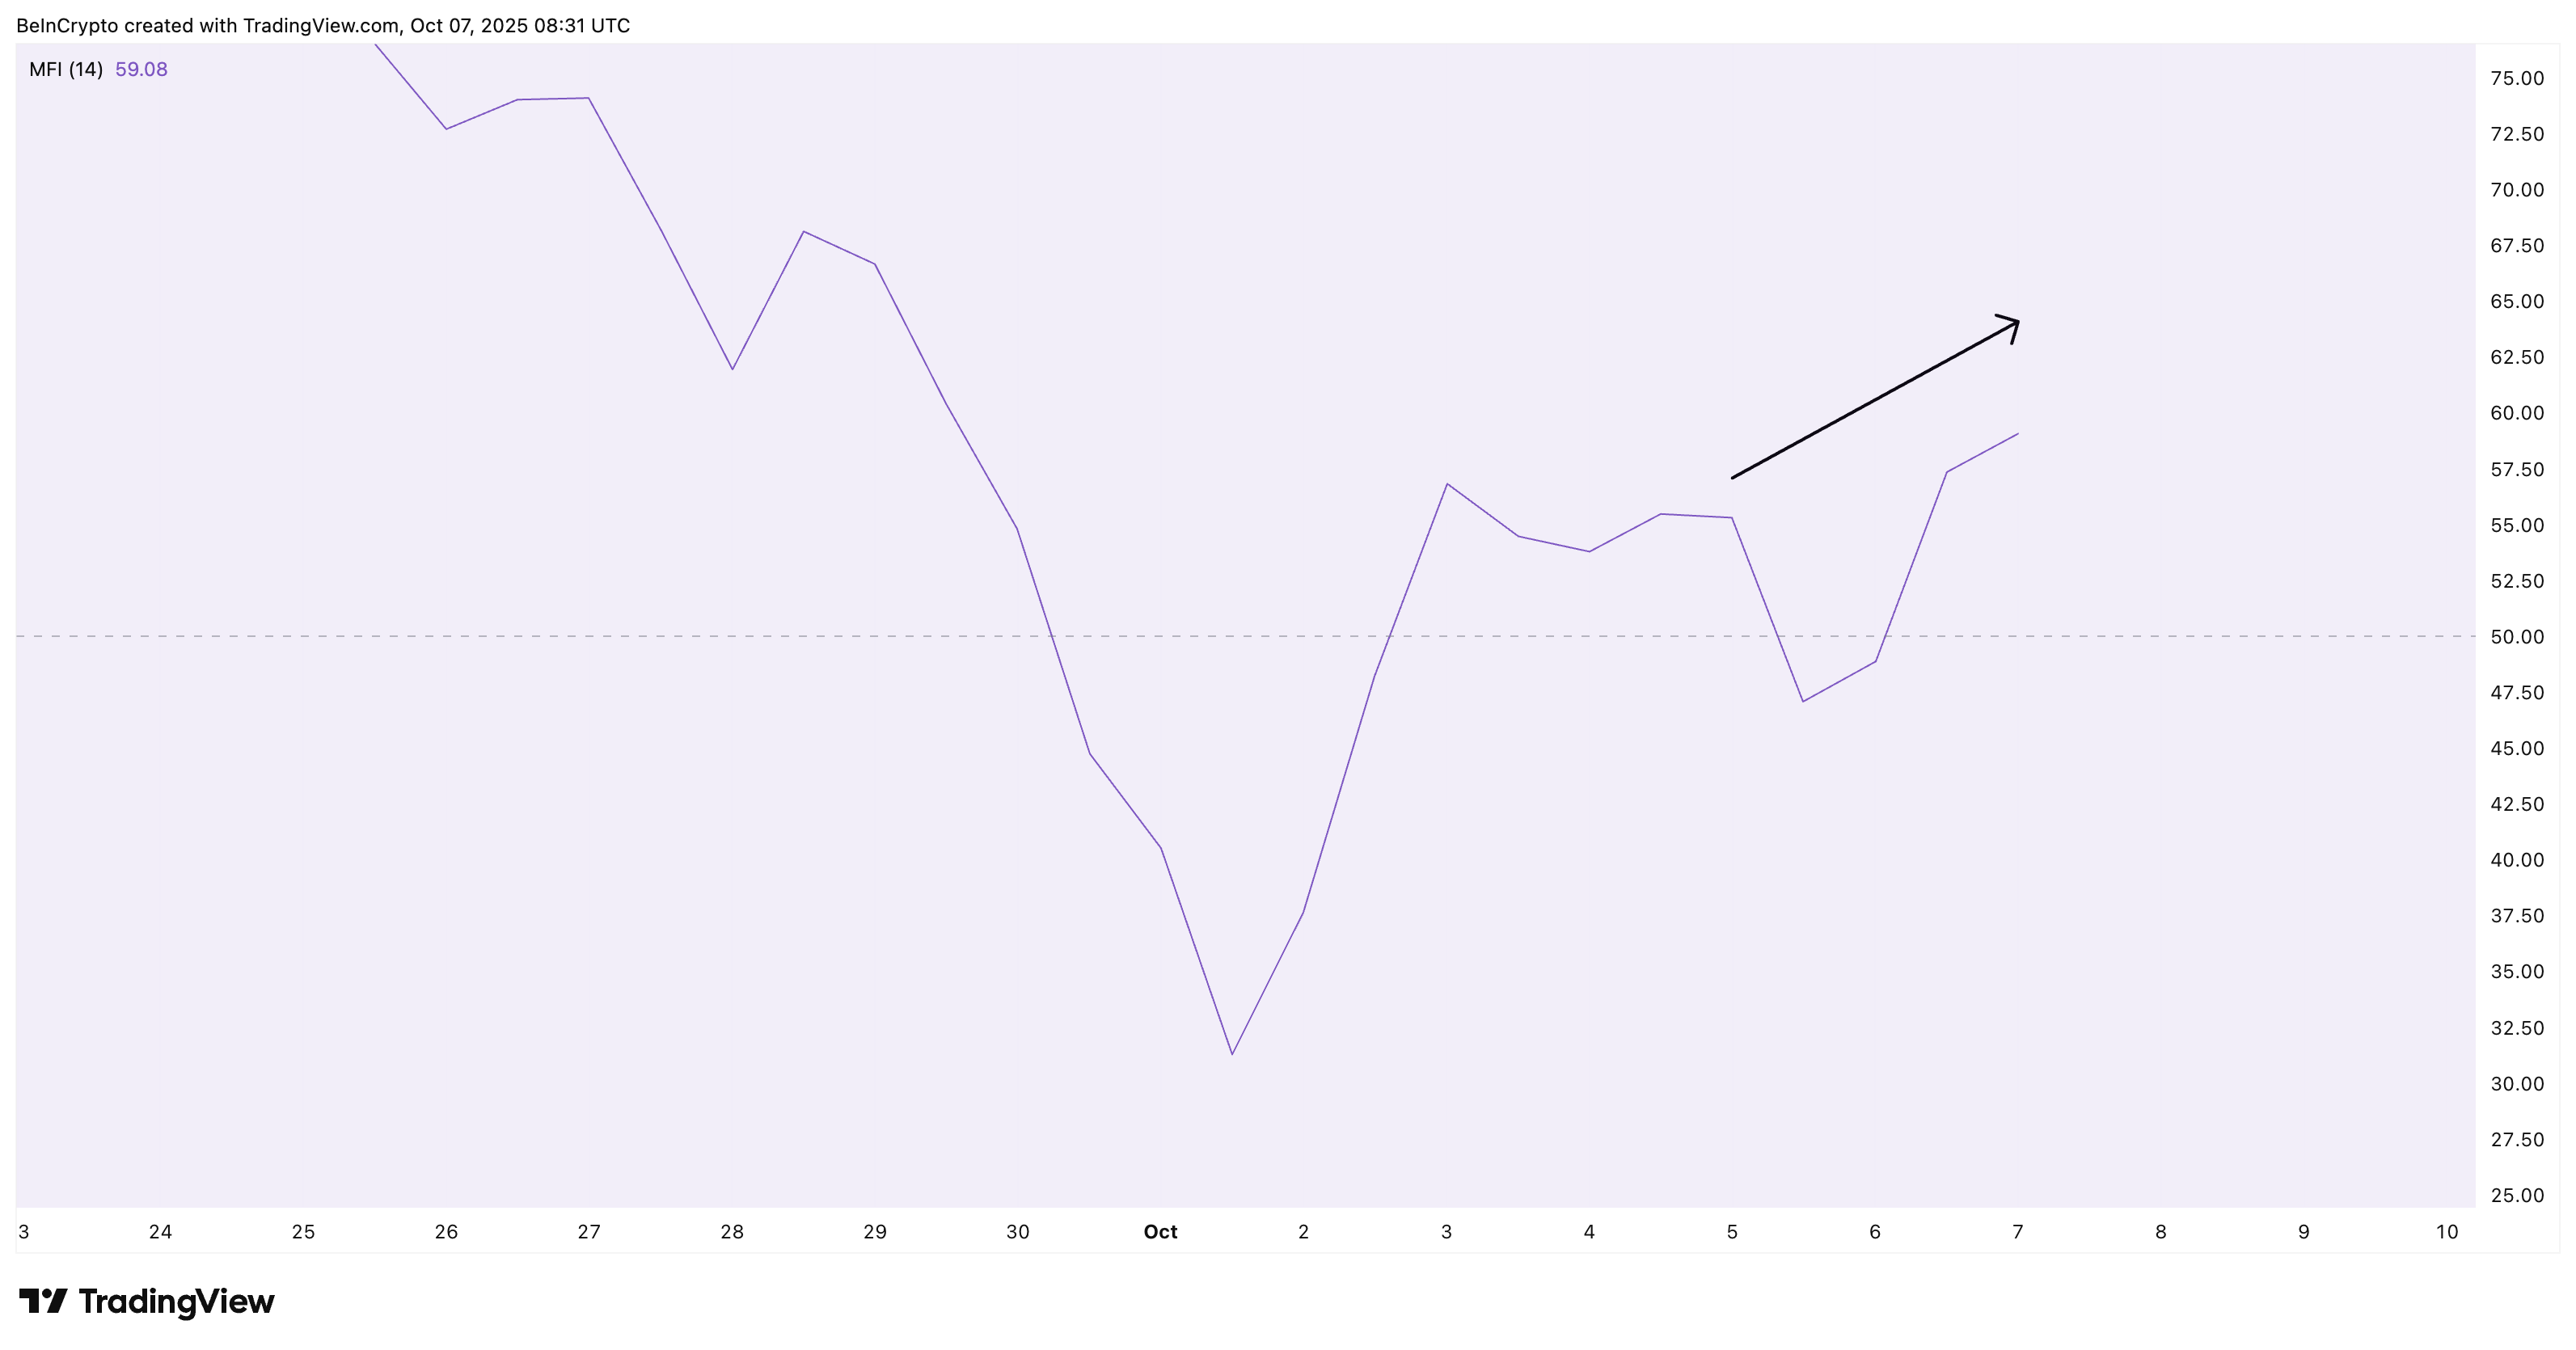 ASTER MFI Still Trending Higher:
If these inflows were truly sell-driven, MFI would have dropped. Instead, it’s rising toward 65, signaling that money is still flowing into ASTER.
The Bull-Bear Power (BBP) indicator backs this up. BBP compares buying and selling momentum; when it’s green, bulls dominate. Since October 5, BBP bars have turned positive, showing renewed strength.
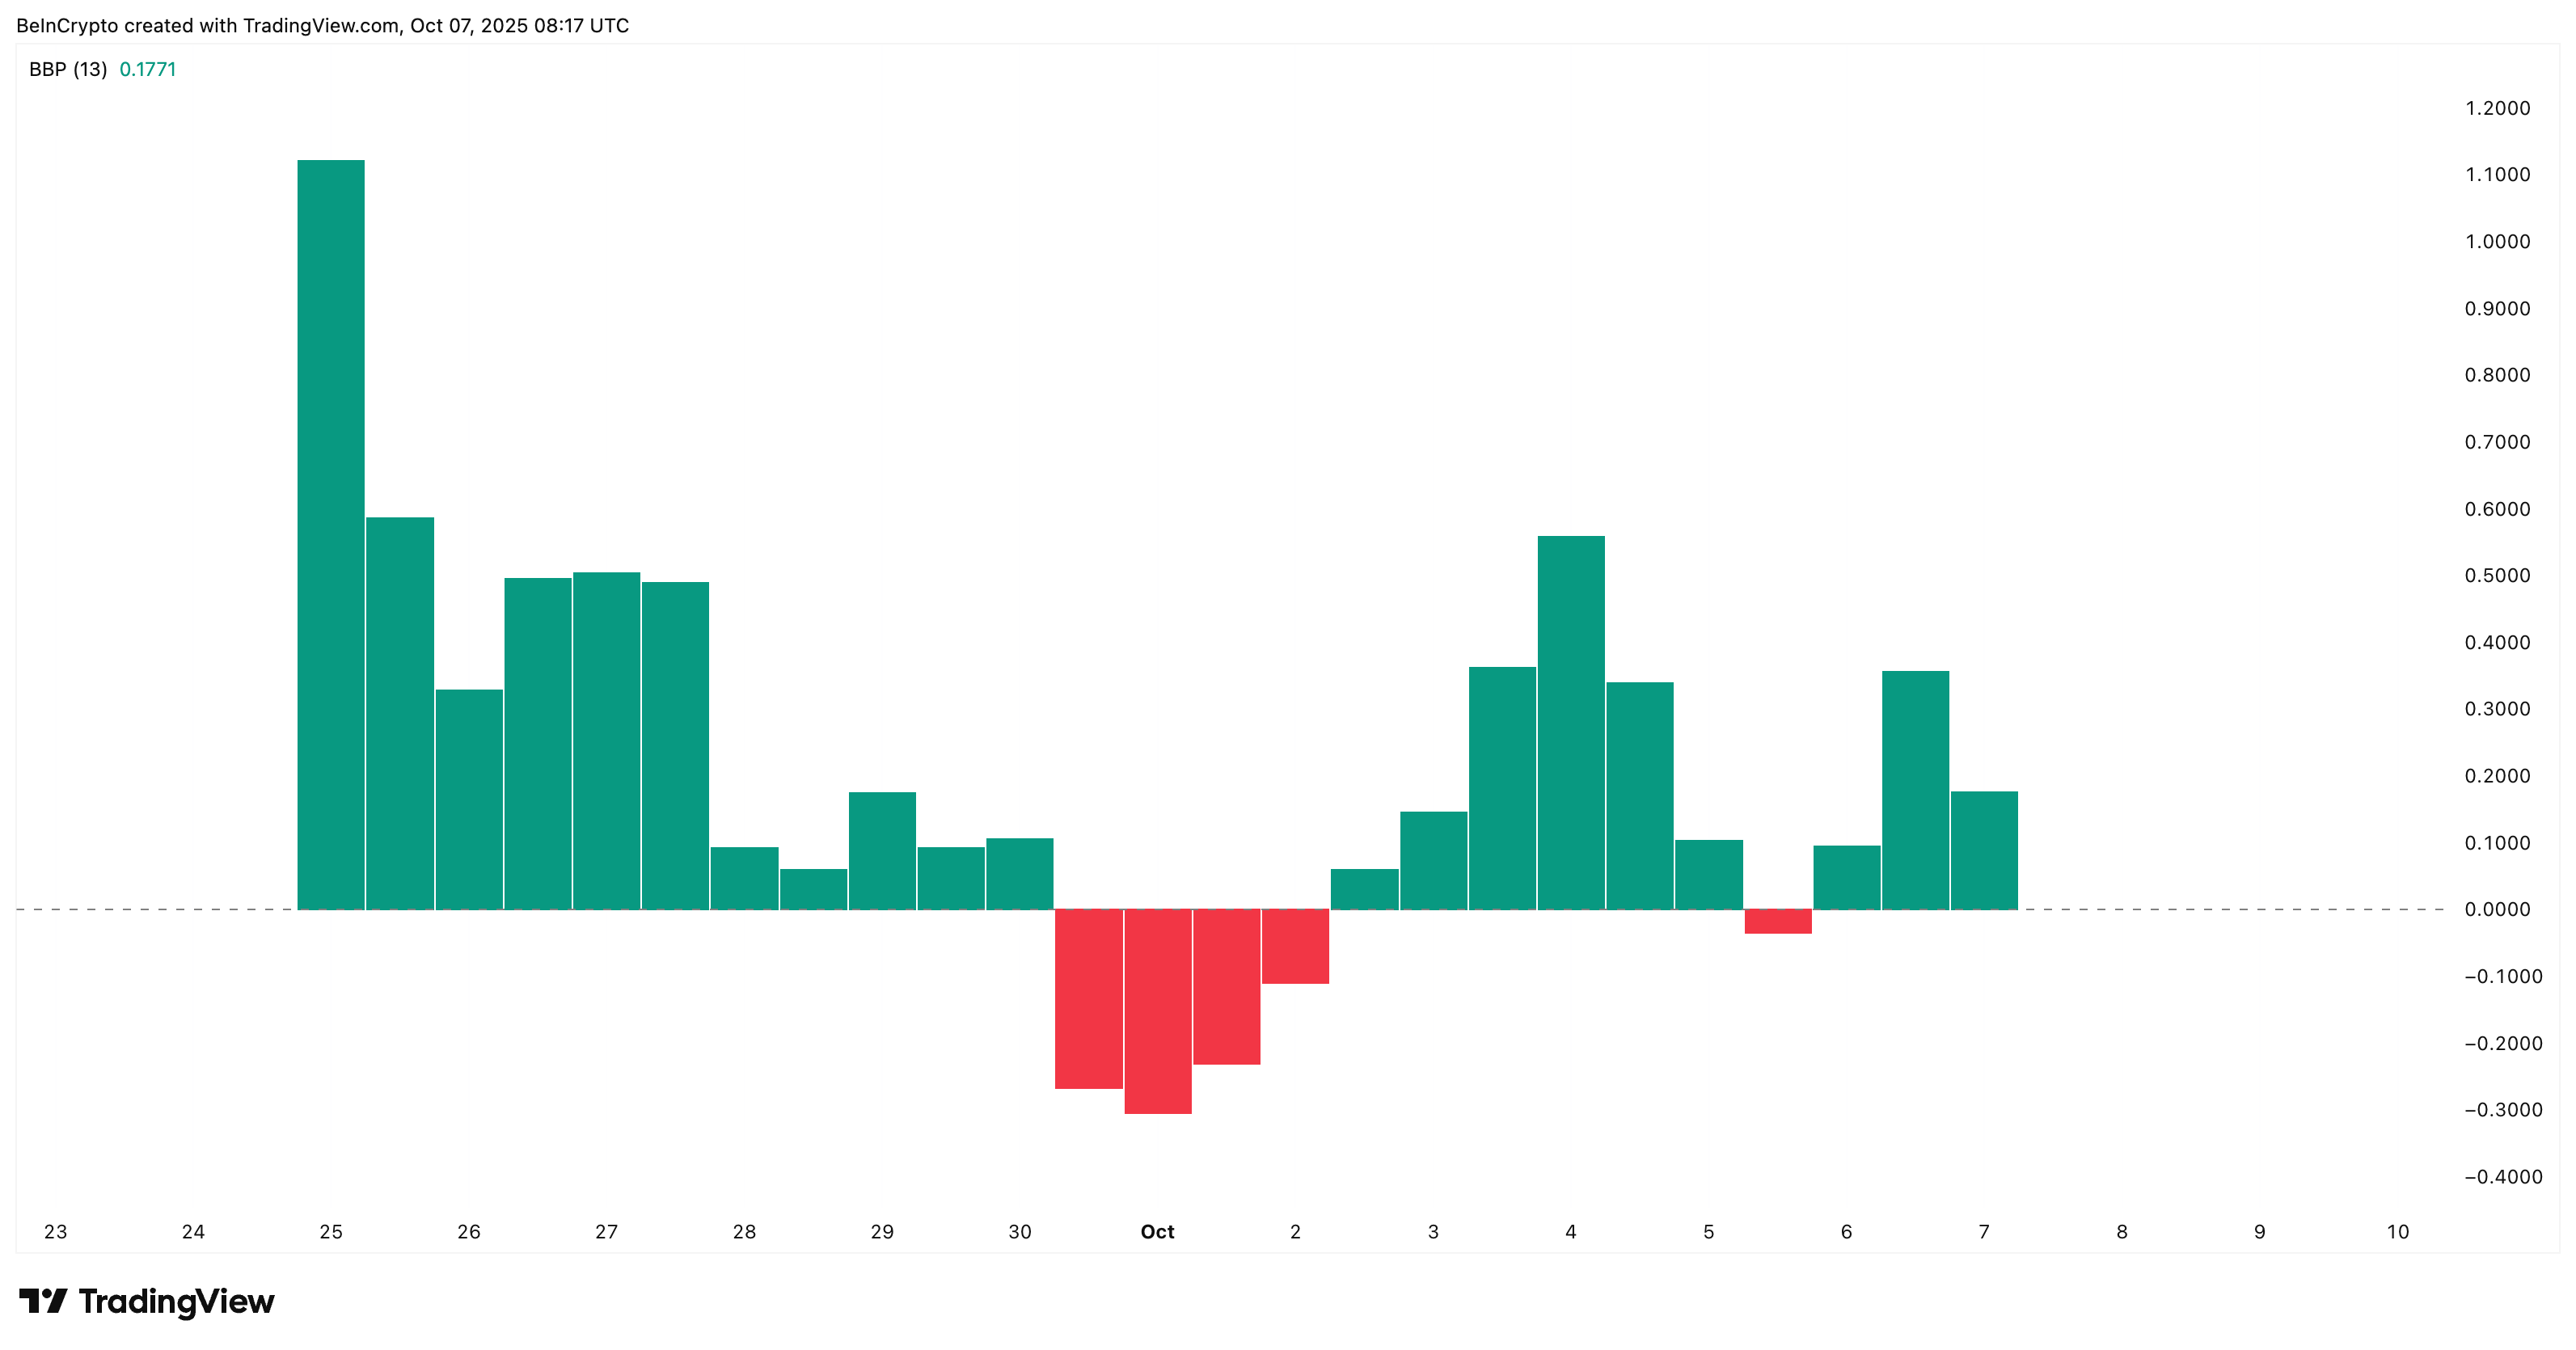 ASTER Bulls In Power:
These two readings together suggest the so-called “selling pressure” might be a liquidity mirage, not a trend reversal.
Hidden Bullish Divergence Keeps ASTER Price Uptrend Intact
The 12-hour chart shows ASTER trading within an ascending triangle (with the ascending trendline acting as support), a structure that usually favors buyers.
Between September 30 and October 5, the Relative Strength Index (RSI) — which tracks market momentum — made a lower low, while prices made a higher low. This is called a hidden bullish divergence, a pattern that often confirms the continuation of an uptrend courtesy of fading selling pressure.
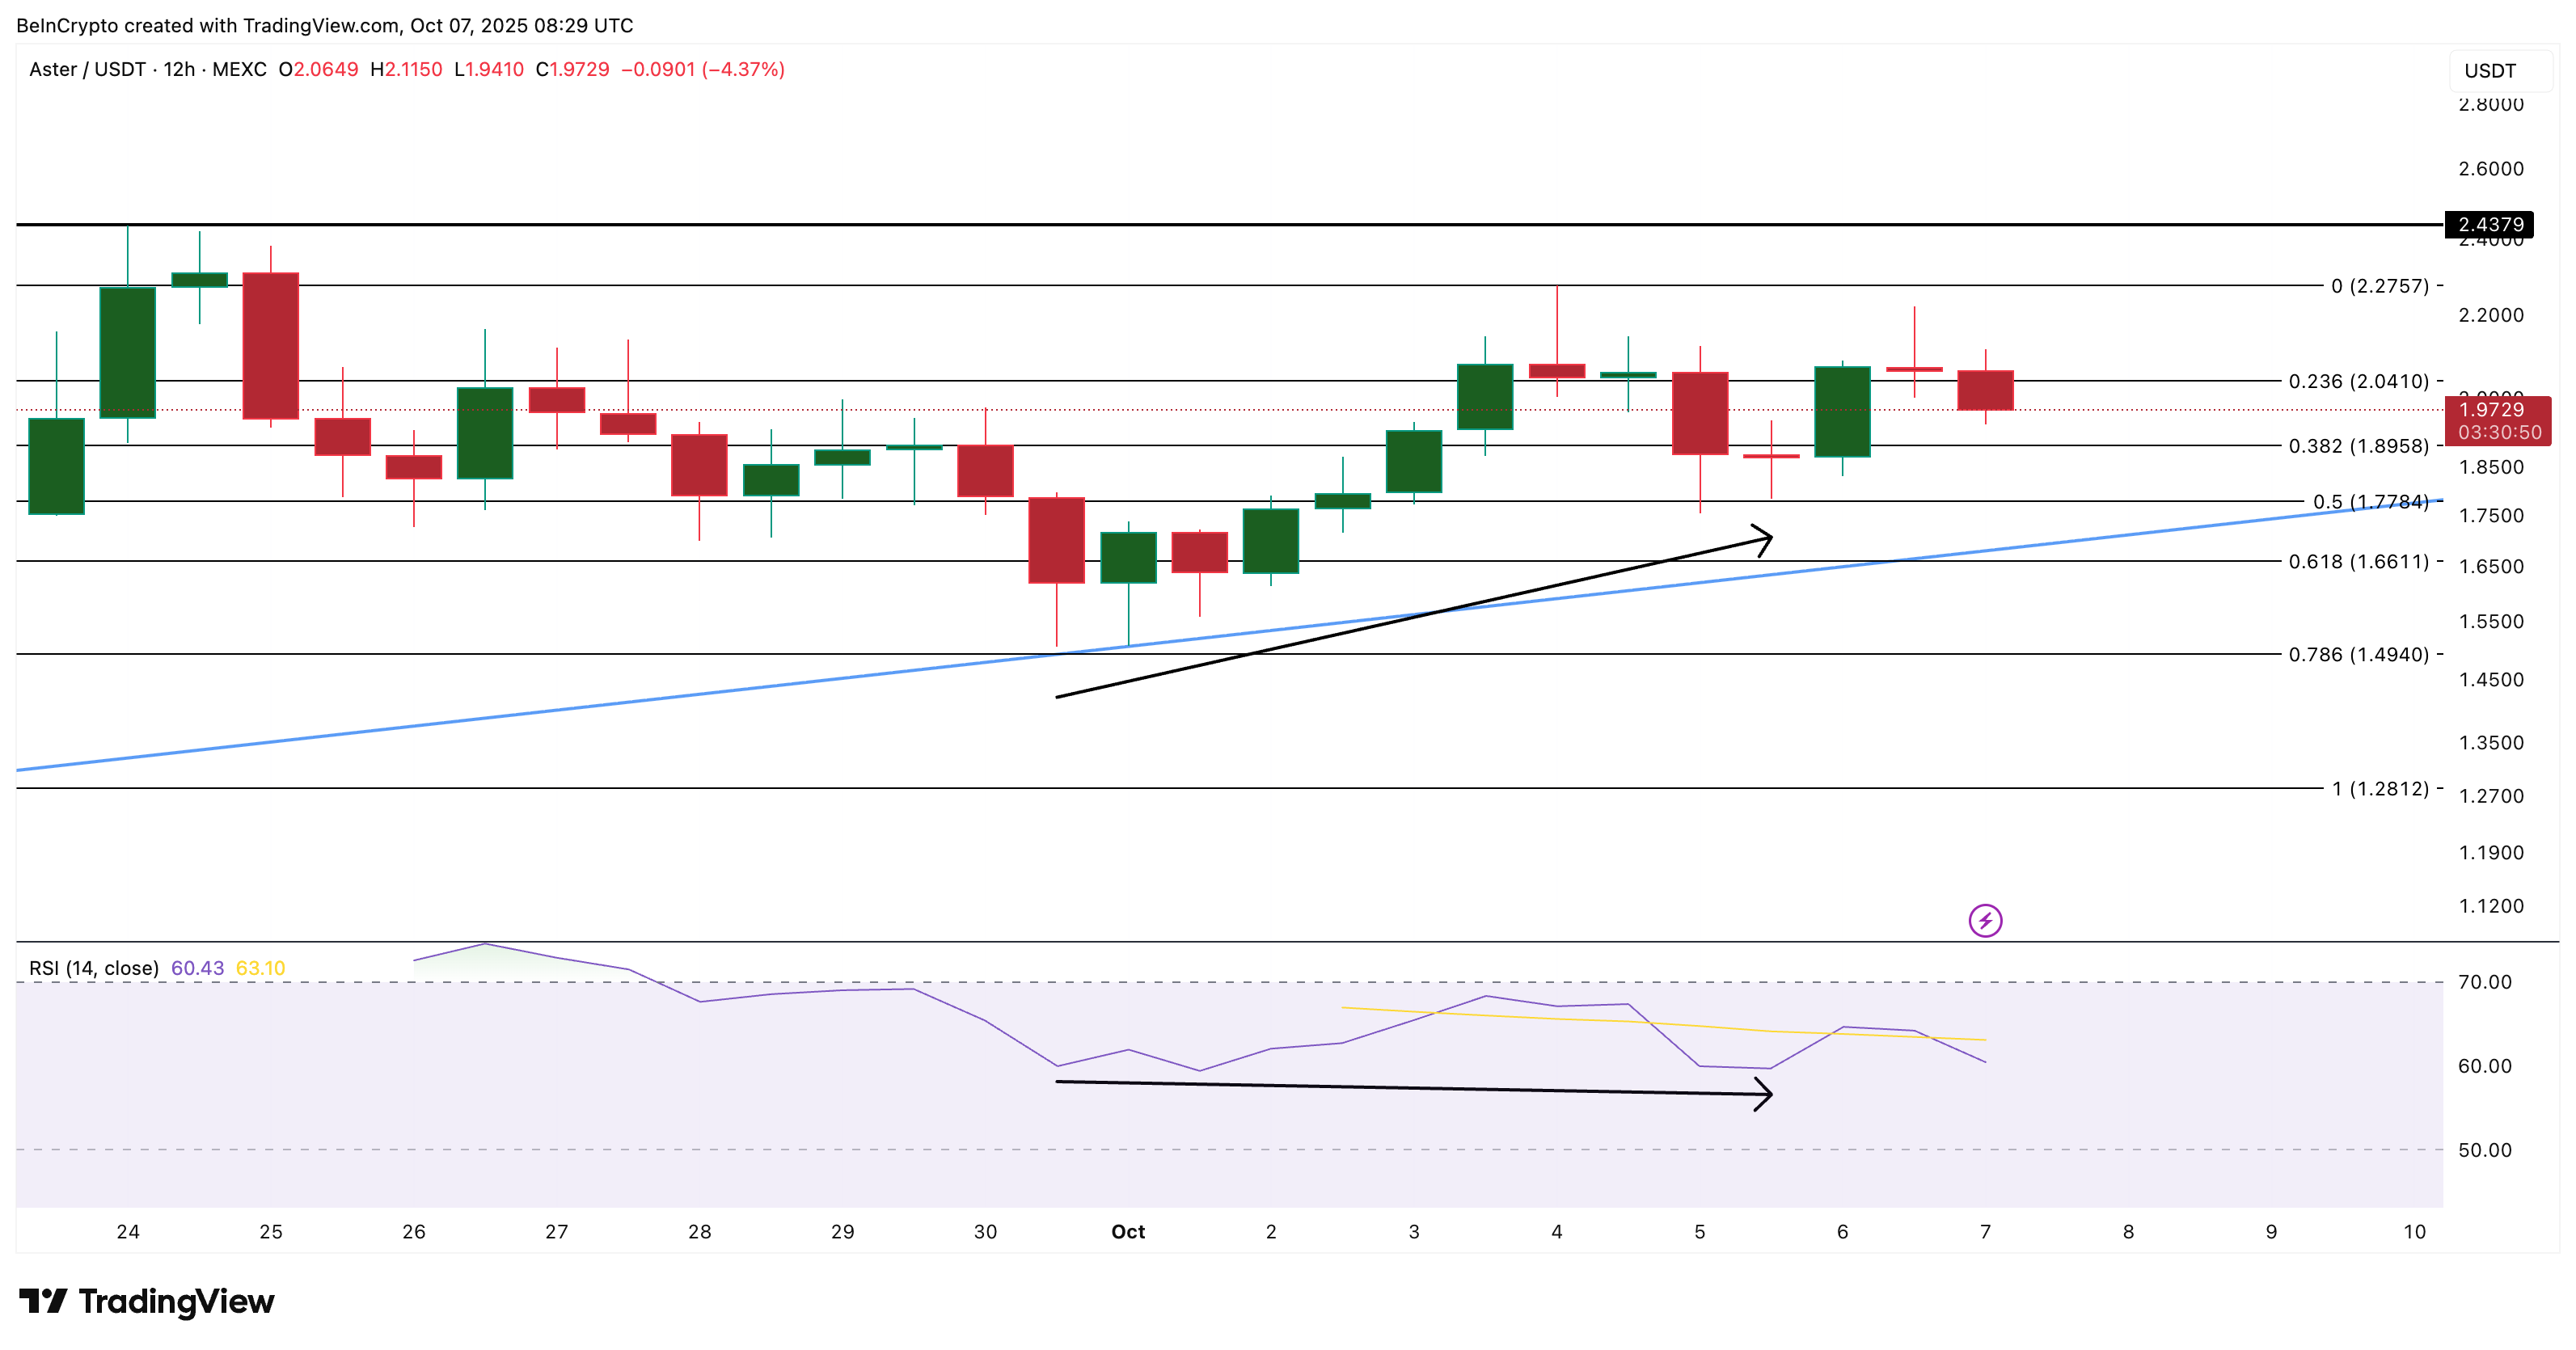 ASTER Price Analysis:
Key resistance sits at $2.04, $2.27, and $2.43 (ASTER’s all-time high). A 12-hour candle close above $2.27 would confirm breakout strength and could open the door to a new high above $2.43.
However, if the ASTER price dips under $1.77 and then under $1.66, thereby breaching the triangle on the downside, the bullish hypothesis would get invalidated.
As long as RSI stays above 50 and BBP remains positive, bulls hold the edge. For now, ASTER’s price action tells a simple story: the big holders haven’t left the table — and neither should the market’s attention.
Disclaimer: The content of this article solely reflects the author's opinion and does not represent the platform in any capacity. This article is not intended to serve as a reference for making investment decisions.
You may also like
Hyperliquid News Today: MUTM Soars by $19M While MegaETH Plummets: Real Performance Outshines Hype in the Evolving Crypto Landscape
- Mutuum Finance (MUTM) raised $19M in Phase 6 presale, with 250% price growth since 2025 launch and 90% allocation completed. - KuCoin secured AUSTRAC and MiCA licenses, expanding compliance reach across 29 EEA countries while acquiring payment firms to strengthen institutional credibility. - Bitcoin surged past $90K amid Fed rate cut speculation, contrasting MegaETH's $1B token sale collapse due to technical failures, highlighting execution risks in volatile markets. - Crypto exchanges pledged $3.19M for

Bitcoin News Update: Triple Bearish Divergence in Bitcoin Suggests ETF Rally May Be Unstable
- Bitcoin trades near $86.6K, down 31.3% from October peak amid $3.5B November ETF outflows and $2B liquidations. - Technical analysis flags "triple bearish divergence" as price hits higher highs while momentum indicators weaken. - Spot Bitcoin ETFs see $238M inflows but face $90K resistance; Ethereum ETFs gain $175M yet ETH remains below $3,000. - Key support at $85K risks accelerating sell-off to $80K, with 50–60% retracement targeting $34,409–$44,100 if bearish pattern completes.

CME Outage Highlights Cooling Systems as the Global Market’s Major Vulnerability
- CME's 2025 outage exposed cooling systems as critical vulnerability, halting 90% of global derivatives trading via CyrusOne data center failure. - Frozen prices in WTI, S&P 500 futures, and gold triggered erratic movements, with silver dropping $1 amid widened bid-ask spreads. - Despite robust financials ($1.54B revenue Q3 2025), CME faces infrastructure scrutiny as crypto futures growth plans clash with outage risks. - 24/7 crypto trading expansion scheduled for 2026 highlights need for resilient system
Gold Climbs as Fed Faces Uncertainty Over December Rate Cut Amid Limited Data
- Gold prices hit $4,120/oz as Fed rate cut expectations dropped to 33% due to delayed November jobs data, triggering market uncertainty. - JPMorgan and Goldman Sachs project gold to reach $5,055/oz by 2026, citing central bank demand and potential Fed policy neutrality. - Asian markets showed mixed performance while U.S. equity futures wavered, reflecting fragility amid geopolitical tensions and Fed leadership speculation. - Geopolitical risks, including U.S.-Ukraine peace talks and China's semiconductor