Ethereum Price Prediction: Liquidations Increase, ETH Short Positions Decrease

Ethereum Price Today: $2,830
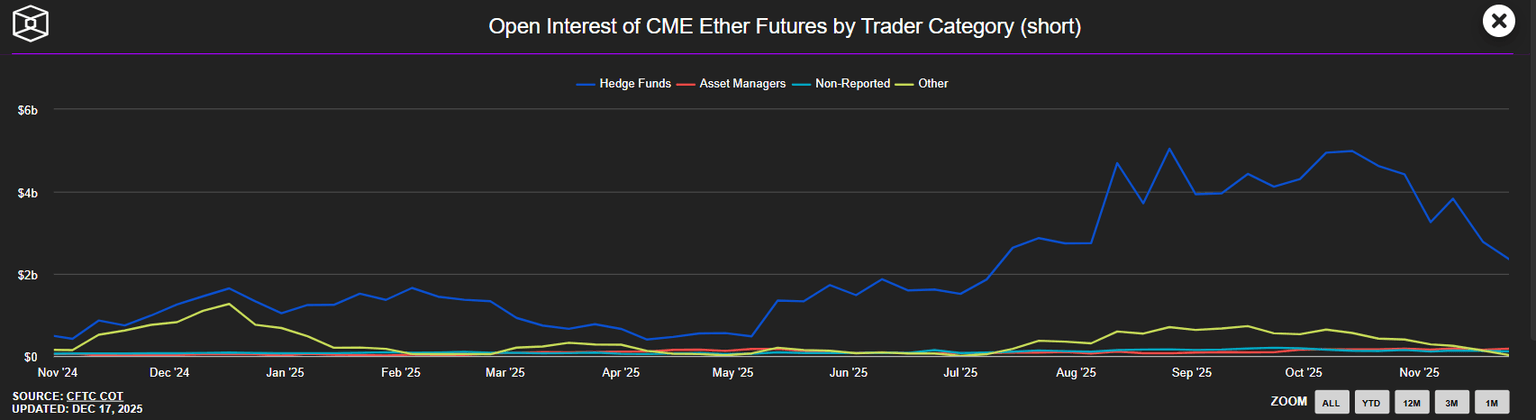
- Since the crash on October 10, Ethereum's short open interest has contracted over the past few weeks.
- ETH exchange reserves have dropped to their lowest level since 2016.
- If Ethereum fails to rebound from the symmetrical triangle support, it could fall to $2,626.
Since October 10, short positions on Ethereum (ETH) have been steadily decreasing over the past few weeks, with leverage being flushed out.
The total open interest in short positions on Ethereum (ETH) at the Chicago Mercantile Exchange (CME) has shrunk from about $5 billion in October to $2.36 billion. The persistent price decline over the past few weeks may have prompted most short traders to close their positions. Open interest refers to the total value of unsettled contracts in the derivatives market.
Binance's net trading volume for Ethereum has also shown a similar trend. This indicator tracks the difference in trading volume between buyers and sellers using market orders to buy Ethereum contracts. As of December 16 (UTC+8), this indicator has rebounded from -$570 million in September to about $108 million.
The continued reduction in short positions means that Ethereum's selling pressure is decreasing, thereby reducing downside risk.
Ethereum Spot Market Buying Remains Strong.
On the spot side, Ethereum exchange reserves (measuring the total number of tokens held by exchanges) have dropped to 16.2 million ETH, the lowest level since 2016.
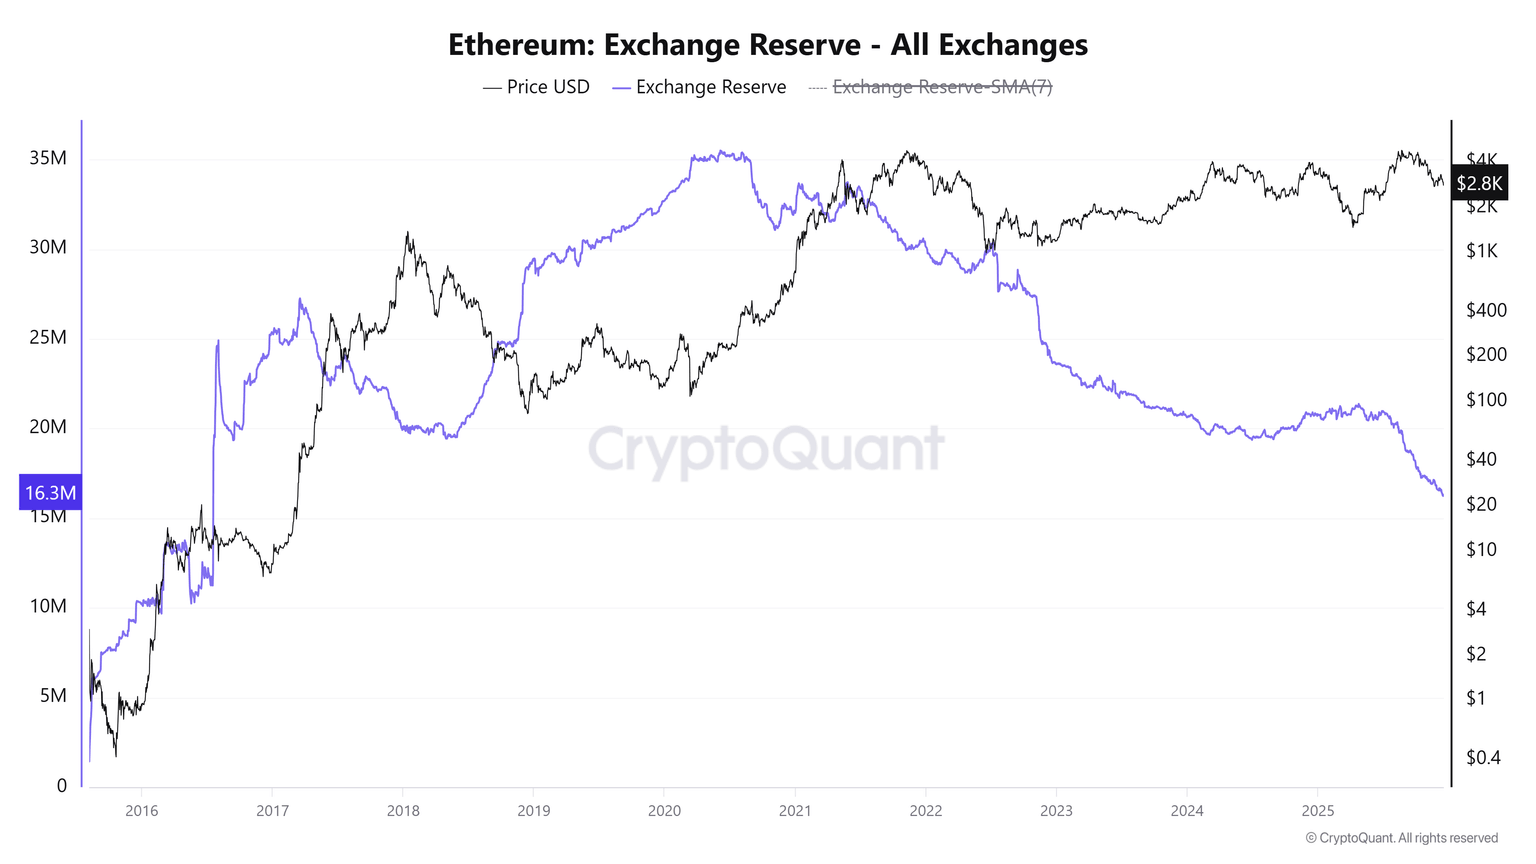
Most of these tokens have flowed into whale wallets holding between 10,000 and 100,000 ETH. From October to December, their cumulative holdings increased by 2.85 million ETH, highlighting this group's strong buy-the-dip attitude.
Ethereum Price Prediction: ETH Tests Symmetrical Triangle Support
According to Coinglass data, Ethereum experienced $114.5 million in liquidations in the past 24 hours, with $110.8 million being long liquidations.
On Wednesday, Ethereum (ETH) encountered resistance near the 20-day Exponential Moving Average (EMA) and is now testing the lower boundary of the symmetrical triangle.
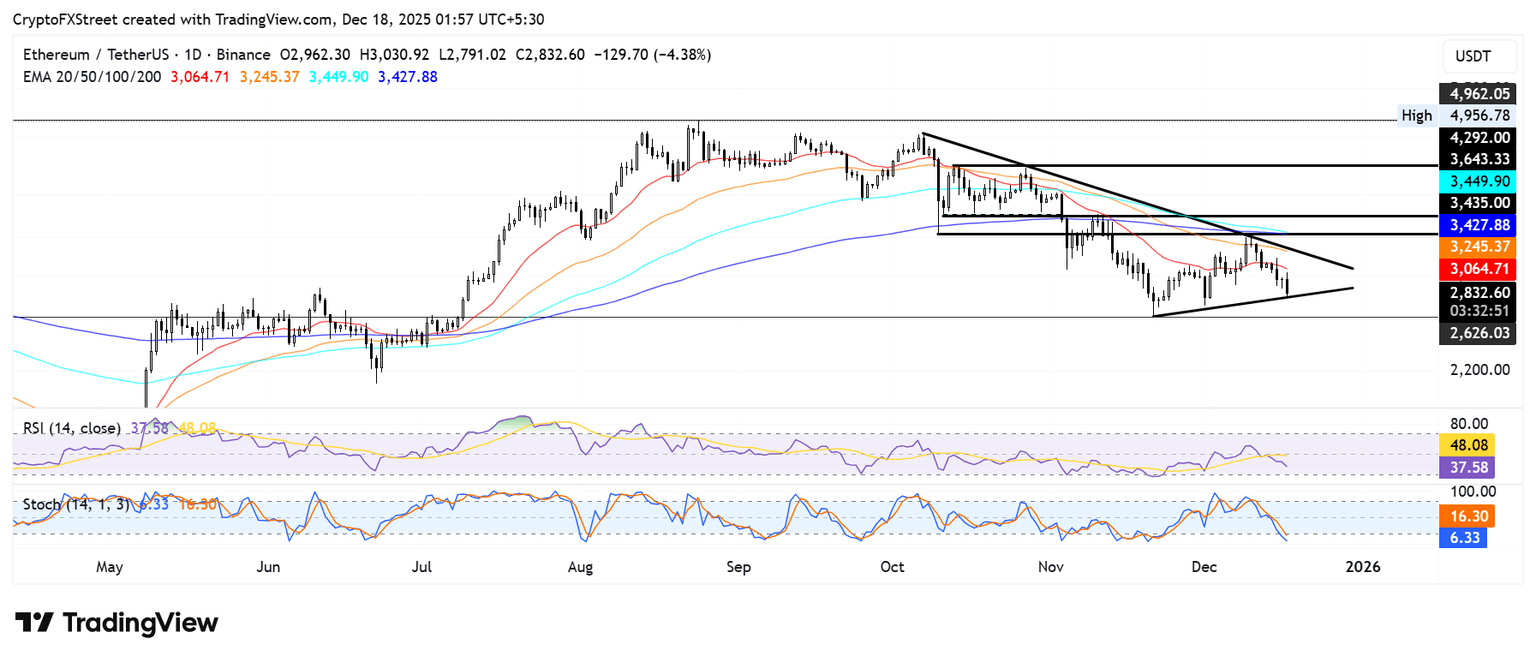
If Ethereum's price holds the triangle support, it could retest the 20-day moving average. If it breaks through this support, Ethereum's price could test the upper boundary of the triangle, near the 50-day moving average.
On the downside, if Ethereum falls below the lower boundary of the triangle, it may find support near $2,626 (UTC+8).
The Relative Strength Index (RSI) continues to decline, falling below the neutral level, while the Stochastic Oscillator (Stoch) remains in the oversold zone. This trend indicates that bearish momentum is increasing, but given the oversold state of the Stochastic Oscillator, there is still a possibility of a reversal.
Disclaimer: The content of this article solely reflects the author's opinion and does not represent the platform in any capacity. This article is not intended to serve as a reference for making investment decisions.
You may also like
XRP Rich List: Can Long-Term Holders Realistically Retire on Crypto Gains?
Santa Rally Hopes Fade as Bitcoin Jumps to $90K, Then Falls Even Harder
Nexo Initiates Multi-Year Global Collaboration with Tennis Australia