
XRP/USD price consolidates: Triangle pattern signals imminent breakout

XRP, a cryptocurrency specifically designed for fast cross-border payments, is seeing Ripple Labs' stock price approach a technical inflection point, making traders increasingly nervous. After the price dropped from above the $3 region in early October, its performance over the past two months has been intriguing—it has been squeezed between two converging trendlines, and now these two lines are forcing it to make a decision.
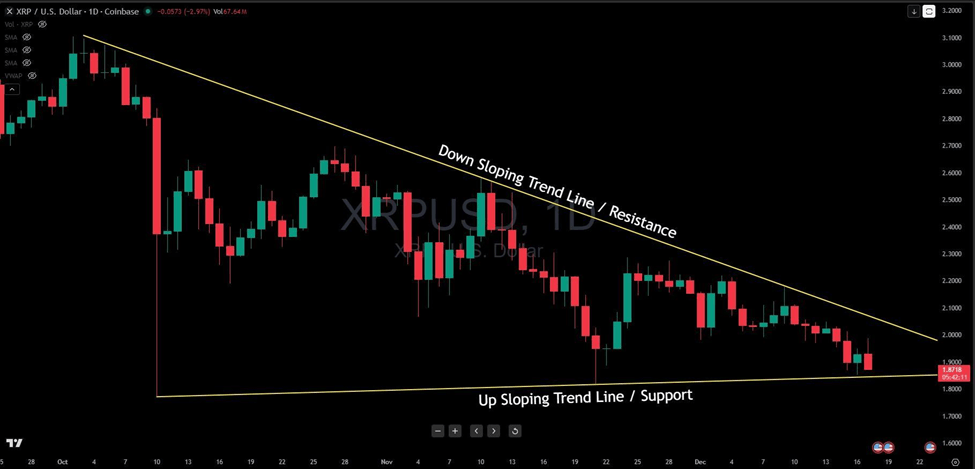
Let’s take a closer look at what the chart reveals. Since early October, the descending resistance trendline has consistently capped the price, thwarting rebound attempts and pushing the price lower after each test. Meanwhile, the ascending support trendline has been buying the dips since late October, forming a series of higher lows even as the highs keep getting pressed down. Ultimately, this has formed a textbook symmetrical triangle, which is now nearing its end.
The price is currently hovering near $1.87, close to the lower support trendline—a line that has held firm through multiple tests over the past six weeks. At this point, the “spring” nature of the triangle pattern is unmistakable. The compression has tightened to its limit, and further upward movement is no longer possible. The price must break through the support level.
For the bulls, the key is whether this support line can hold once again. If the price rebounds here and effectively breaks through the descending resistance (let’s call it the $2.10–$2.20 region), the situation will be completely reversed, and the price could steadily recover to the $2.60–$2.80 range, based on the height of the triangle. This scenario requires patience.
But we must also honestly face another possibility. If XRP closes below this ascending support line on the daily chart, the triangle pattern will break downward. Such a breakout could intensify selling pressure, with the price potentially falling to the $1.60–$1.50 region, or even lower. Given how mature this pattern is, if it fails here, a quick rebound in the short term is unlikely.
The volume pattern suggests traders are also waiting and watching. Note that as the pattern matures, trading volume has declined. This is typical for a triangle formation, but it also means that whichever direction the breakout takes, it could be a strong move.
Risk management is straightforward: bulls should wait for a rebound off support, using a daily close below $1.80 as an exit signal. Bears should wait for a confirmed breakdown, establishing short positions only after a daily close below $1.75. The apex of the triangle is fast approaching—possibly within the next week or two—so we’ll know the outcome soon.
XRP is giving us a valuable lesson in patience and pattern recognition. When trendlines converge like this, the market is actually storing up energy, preparing for the next major move. Whether this energy is released upward or downward depends on which side ultimately prevails. Keep a close eye on these trendlines, as one of them is about to be broken.
Disclaimer: The content of this article solely reflects the author's opinion and does not represent the platform in any capacity. This article is not intended to serve as a reference for making investment decisions.
You may also like
Tether Launches PearPass: P2P Password Manager Without Cloud Servers “No Serves to Hack”
Analysis Firm Warned: “‘This is the Average Purchase Level for Bitcoin Investors, Price Should Not Fall Below This Level’”
SWIFT Could Soon Integrate XRP Ledger. Here’s the Latest
City Protocol Partners with Cwallet to Simplify Web3 IP Onboarding for 37 Million Users