JUST Price Prediction: Breakout Stalls As Sellers Test Support After Parabolic Rally

JUST price today trades near $0.0425, easing over 3% in the past 24 hours after a strong breakout that lifted price into a major multi-month resistance zone. The rally paused immediately at the upper boundary of a long-term triangle formation, leading to profit-taking as the market tests whether the breakout has real follow-through.
Price Hits Major Resistance After Strong Rally
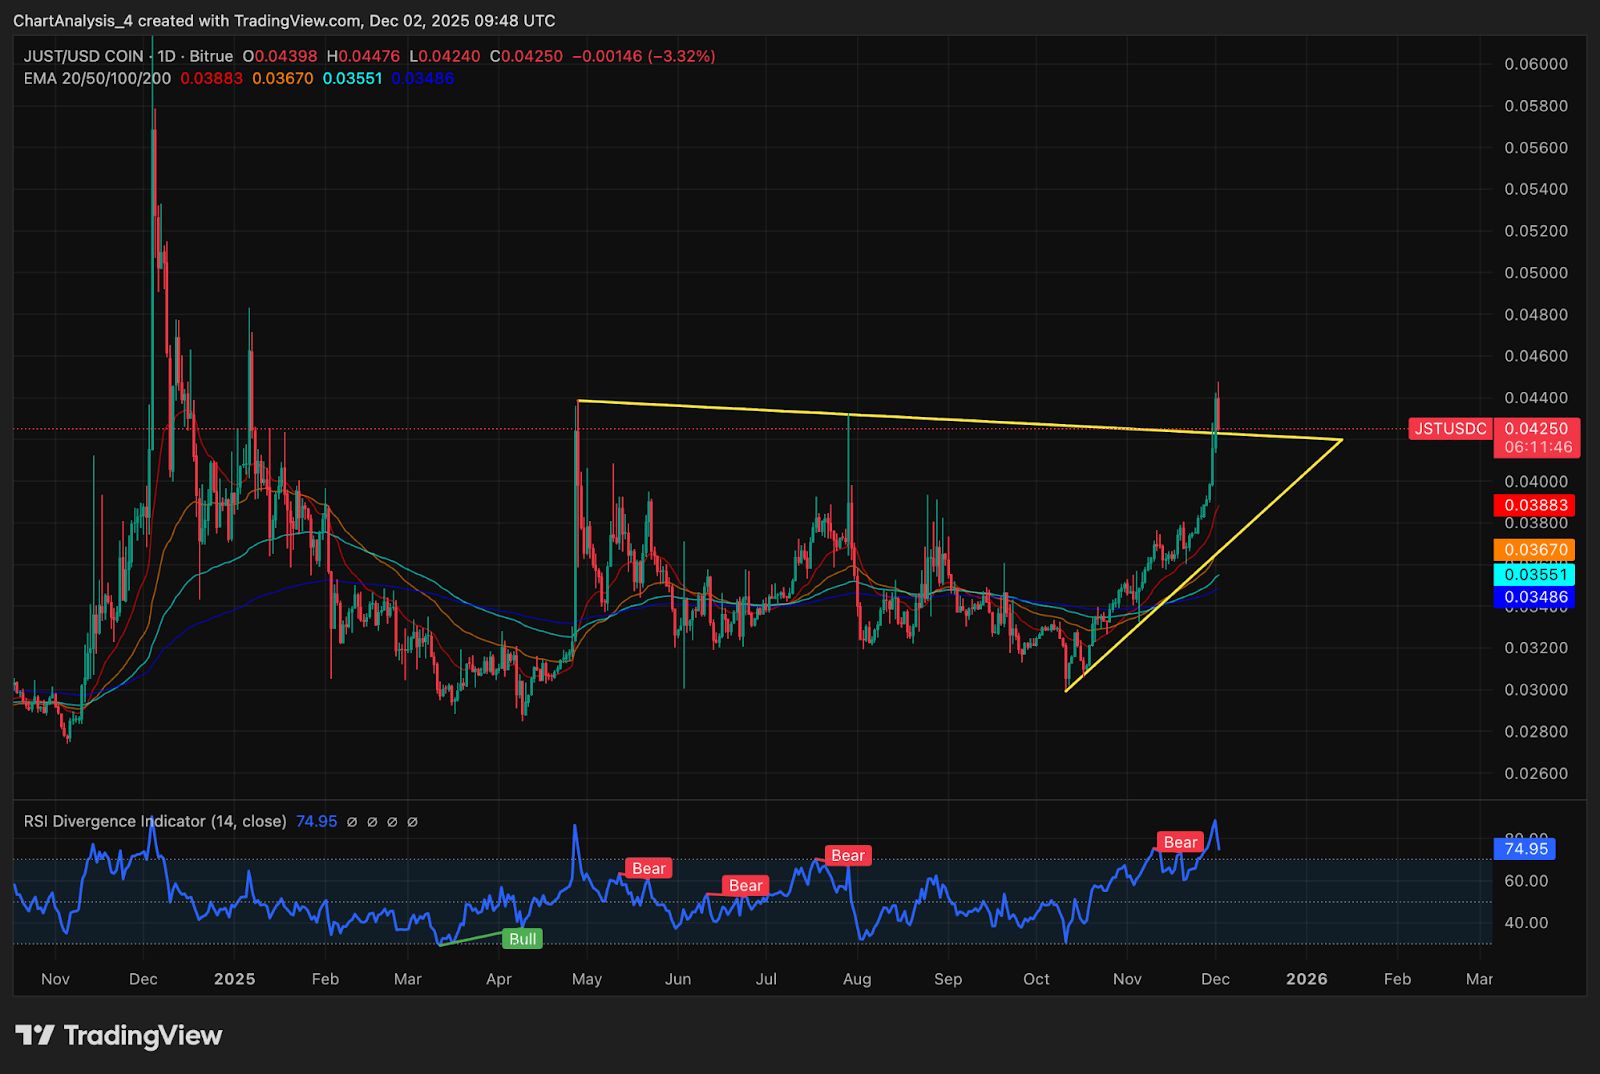
The daily chart shows JUST breaking above a rising wedge base and driving into the horizontal ceiling near $0.0440, which has capped every major rally since April.
Price remains above all major EMAs, which now sit between $0.0348 and $0.0388, establishing a broad support zone beneath current levels. The reclaim of the EMA stack is structurally bullish, but the reaction at resistance determines whether the breakout transitions into trend expansion or stalls into consolidation.
RSI sits near 74, signaling overbought conditions and increasing risk of short-term cooling. The indicator also shows repeated bearish divergence signals on previous peaks, making the current stall notable as traders gauge whether momentum will fade again.
A failure to hold above the rising support line drawn from the late October low exposes a deeper pullback toward the EMA cluster.
Intraday Charts Show Initial Retest Of Support

On the 30-minute chart, JUST is testing the rising trendline that supported the breakout. Price briefly slipped below the line before reclaiming it, showing early signs of bid absorption.
Supertrend sits overhead at $0.0437, reinforcing that upside is encountering resistance. The Directional Movement Index shows a fading bullish impulse, with ADX flattening while +DI slips beneath related metrics. This supports the idea that momentum has cooled and the rally is transitioning into a retest phase.
A close below the trendline would shift focus toward the $0.0410 to $0.0395 region, where early support formed before the breakout acceleration.
Spot Flows Show Light Distribution
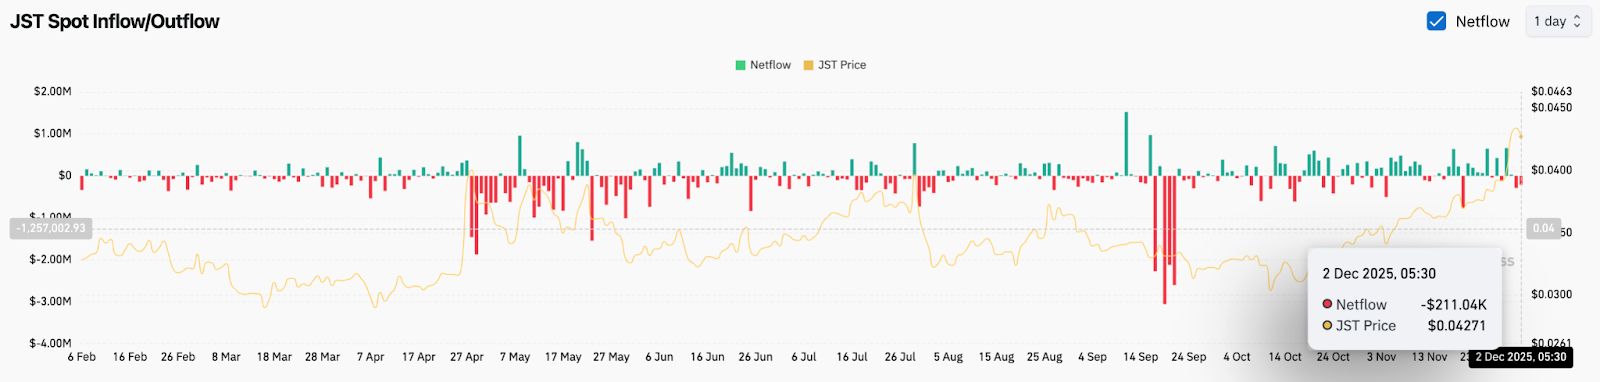
Spot flow data shows a small $211,000 outflow on December 2, reflecting mild distribution after the breakout. Recent days show a mix of green and red prints, indicating balanced participation rather than heavy accumulation or aggressive profit-taking.
This flow profile matches price action. The rally was driven by technical breakout mechanics rather than large-scale inflow, and the current stall reflects traders managing risk rather than exiting en masse.
If spot flows turn positive again, the breakout could regain momentum. Sustained outflows would indicate further cooling.
Outlook. Will JUST Go Up?
JUST remains in a constructive higher timeframe structure after reclaiming the full EMA stack and breaking out from a multi-week base. The current pullback is a standard retest of resistance turned potential support. The next move depends on whether buyers defend that level.
- Bullish case: A bounce from $0.0410 followed by a close above $0.0440 signals continuation toward $0.0460 and $0.0500. Sustained higher lows confirm trend expansion.
- Bearish case: A break below $0.0410 turns the move into a deeper retracement toward $0.0395 and potentially $0.0380. Losing the EMA stack shifts structure back into range-bound behavior.
JUST must hold the rising support to maintain the breakout thesis. Reclaiming $0.0440 turns the pullback into trend continuation, while losing $0.0410 exposes a cooldown toward the mid-$0.03 area.
Disclaimer: The content of this article solely reflects the author's opinion and does not represent the platform in any capacity. This article is not intended to serve as a reference for making investment decisions.
You may also like
Solana's Abrupt Decline: Underlying Factors and What It Means for Investors
- Solana’s Q3 2025 sell-off reflects strong network performance (80M daily transactions) but a $352.8M company net loss from derivatives and financing costs. - Market sentiment diverged: $113.5B market cap growth vs. 6.87% stock drop post-earnings, driven by macroeconomic risks and regulatory uncertainty. - Upgrades like Alpenglow (150ms finality) and ZK Compression v2 (5,200x cost reduction) position Solana for institutional adoption despite short-term volatility. - Investors face a dilemma: 32.7% DeFi TV

DASH Price Increases by 1.78% Following Significant Insider's Share Sale Filing
- DoorDash’s stock rose 1.78% on Dec 2, 2025, despite a 20.32% weekly drop, showing long-term investor confidence. - Officer Lee Gordon S filed to sell 2,159 shares via Rule 10b5-1 plan, part of routine insider trading strategy . - Director Alfred Lin bought $100M in DASH shares, contrasting with 90-day insider sales of $174.5M. - Institutional investors showed mixed activity, with Panagora buying and Spyglass, Arrowstreet reducing stakes. - Analysts maintain "Moderate Buy" rating, projecting growth amid v

What's Causing the Latest BTC Price Swings: Is It a Macro-Fueled Reevaluation?
- Bitcoin's late 2025 volatility reflects macroeconomic pressures, Fed policy shifts, and regulatory changes impacting institutional demand. - Sharp price swings from $126k to $87k highlight sensitivity to inflation, interest rates, and leveraged trading risks amid delayed economic data. - New U.S. crypto laws and ETF approvals boosted institutional participation, but geopolitical risks and token unlocks maintained uncertainty. - A potential Fed rate cut and stabilizing inflation could reignite risk appeti

The ChainOpera AI Token Collapse: A Cautionary Tale for AI-Powered Cryptocurrency Markets?
- ChainOpera AI (COAI) token's 96% collapse in late 2025 exposed systemic risks in AI-blockchain markets, mirroring 2008 crisis patterns through centralized governance and speculative hype. - COAI's extreme centralization (96% supply in top 10 wallets) and tokenomics (80% locked until 2026) created liquidity crises, undermining blockchain's decentralized ethos. - Regulatory actions intensified post-crash, with SEC/DOJ clarifying custody rules and targeting fraud, yet CLARITY/GENIUS Acts created compliance