To answer this question, we need to look at three dimensions: what these indicators represent, why they are effective, and whether the current market is repeating the "panic ending" phase seen in previous cycles.
I. The Market Has Entered an Extreme Range of Sentiment and Behavior
In this round of decline, sentiment and behavioral indicators have shown a rare consistency.
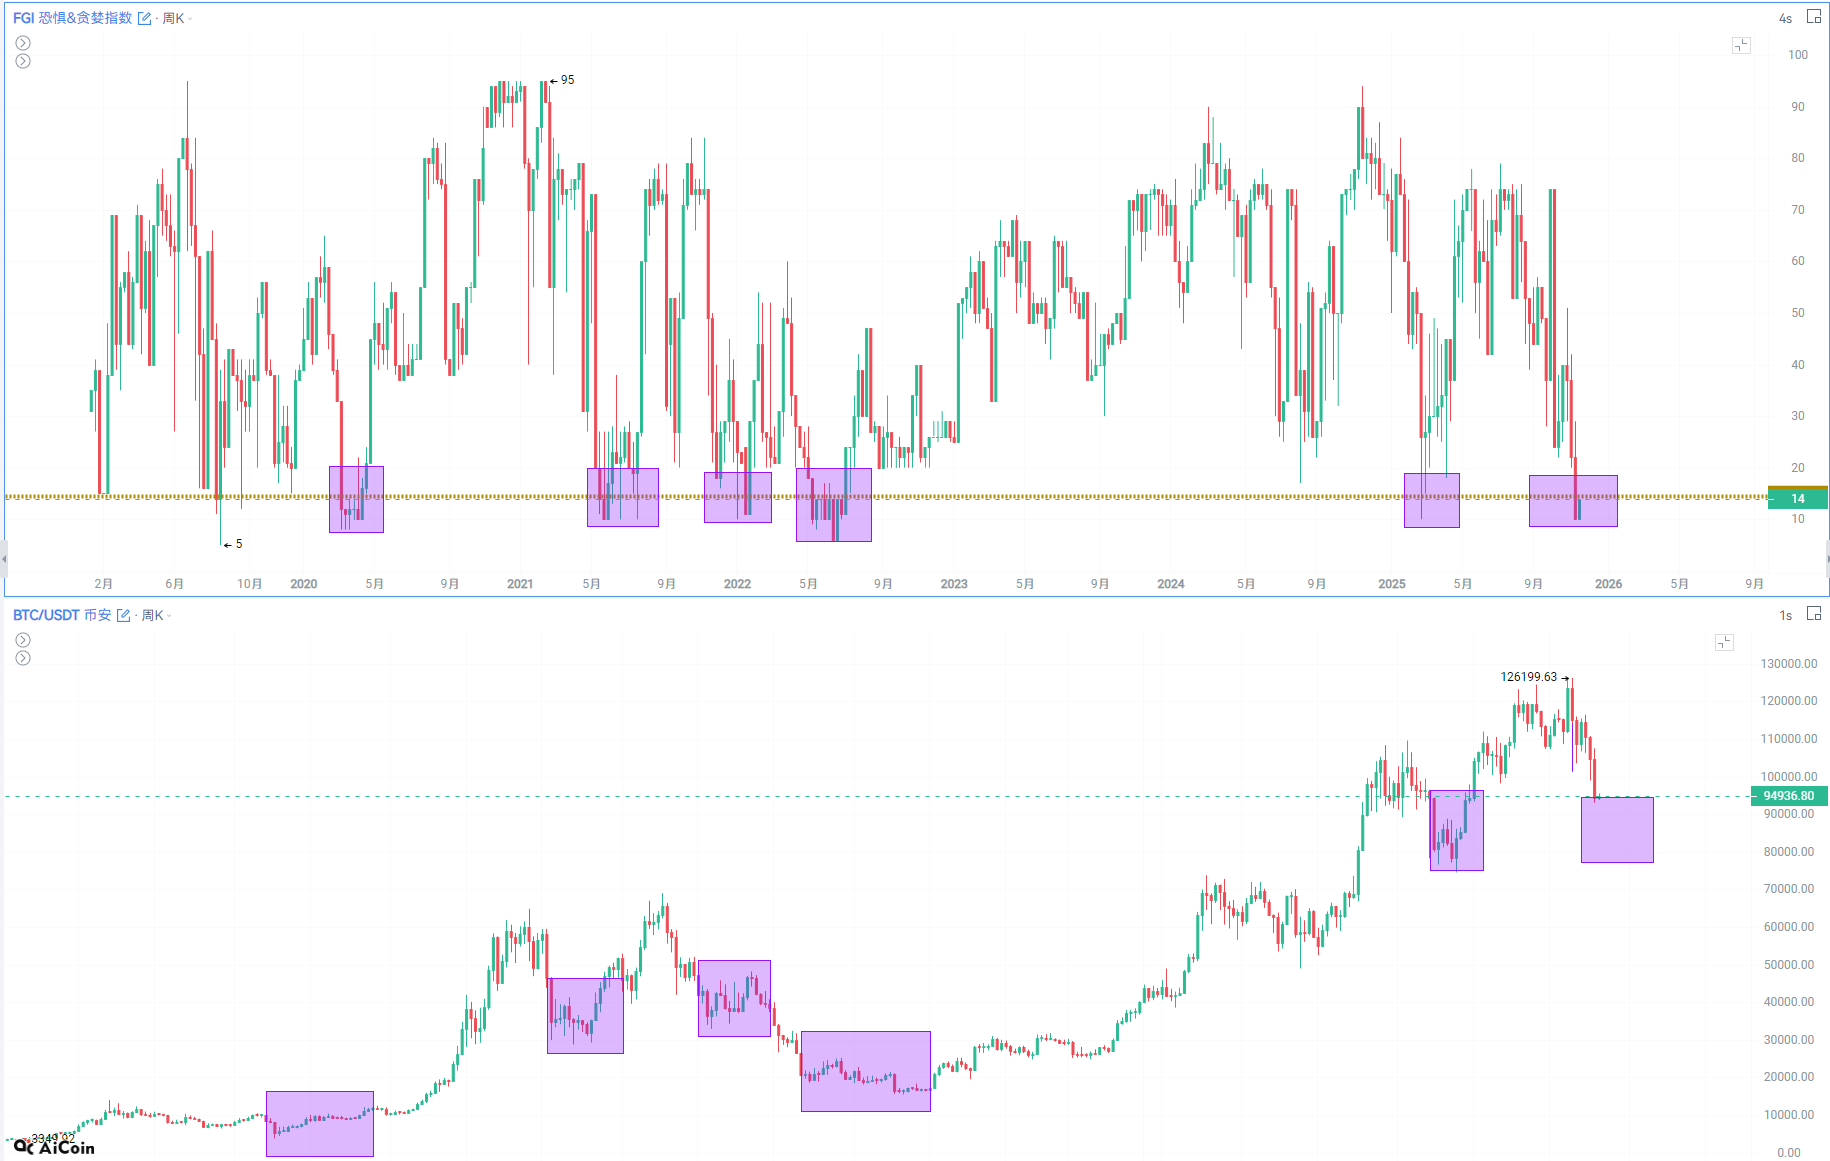
- First, the Fear and Greed Index quickly fell into the extreme fear zone.CoinHistorical data shows that between 2021 and 2025, there were 6 occurrences where the FGI dropped below 15, and in 5 of those, a clear stabilization or rebound followed soon after. This is not a coincidence.
- The FGI is essentially an emotional compressor. When the index falls to extreme fear, it means panic selling is nearing its end, those willing to sell have greatly diminished, while those willing to buy are starting to wait for entry opportunities.
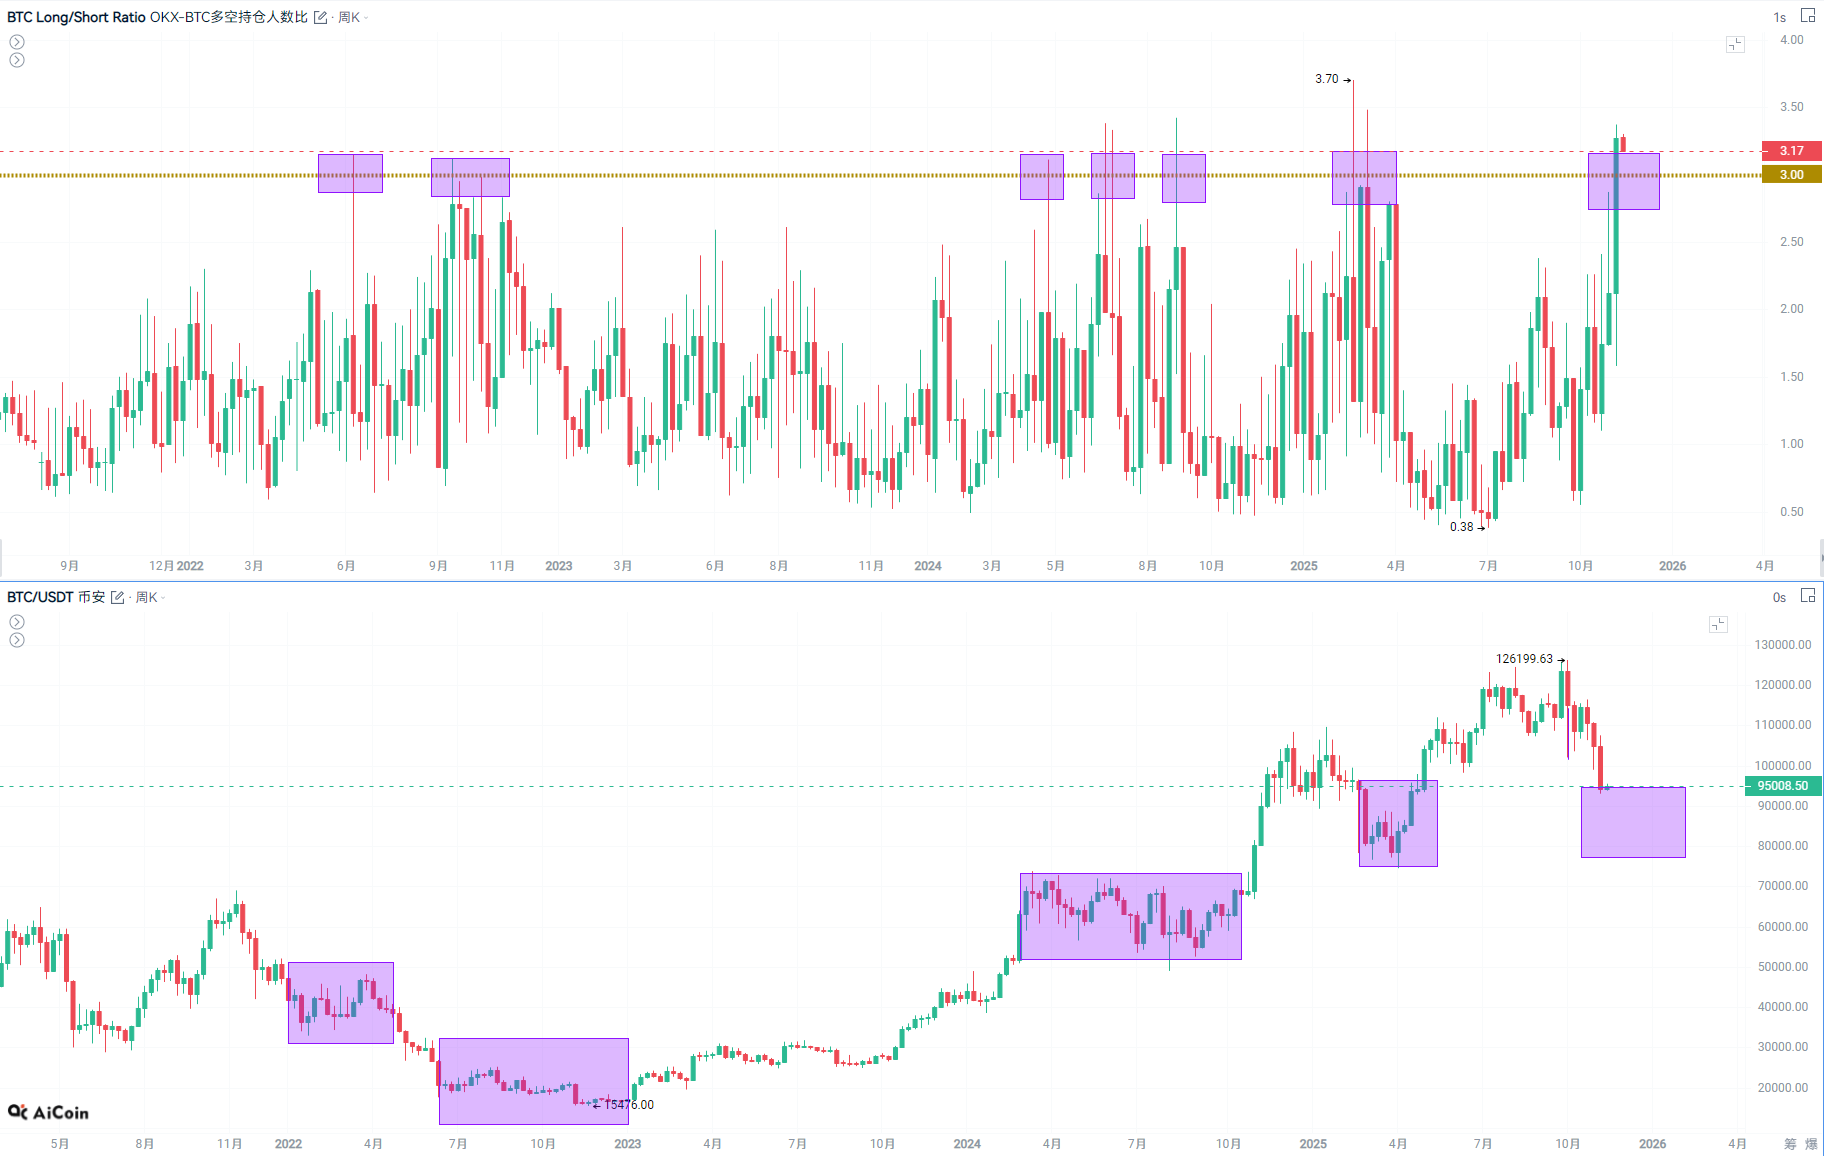
- The second indicator—the Long/Short positionratio—has given an even stronger signal this time. In history, there have been 7 times when the L/S ratio exceeded 3, and each time, bitcoin stabilized or rebounded afterward.
- The reason is simple: this indicator reflects the "number of people" rather than the amount of capital. When retail sentiment is pushed to extremes and bullish sentiment is highly concentrated, it often means the decline is in its later stages and the market is approaching a sentiment peak. In other words, when retail sentiment is highly unified, a reversal is usually not far away.
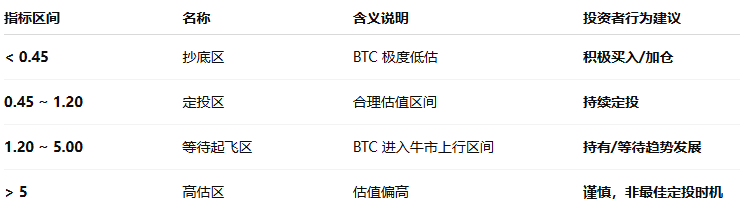
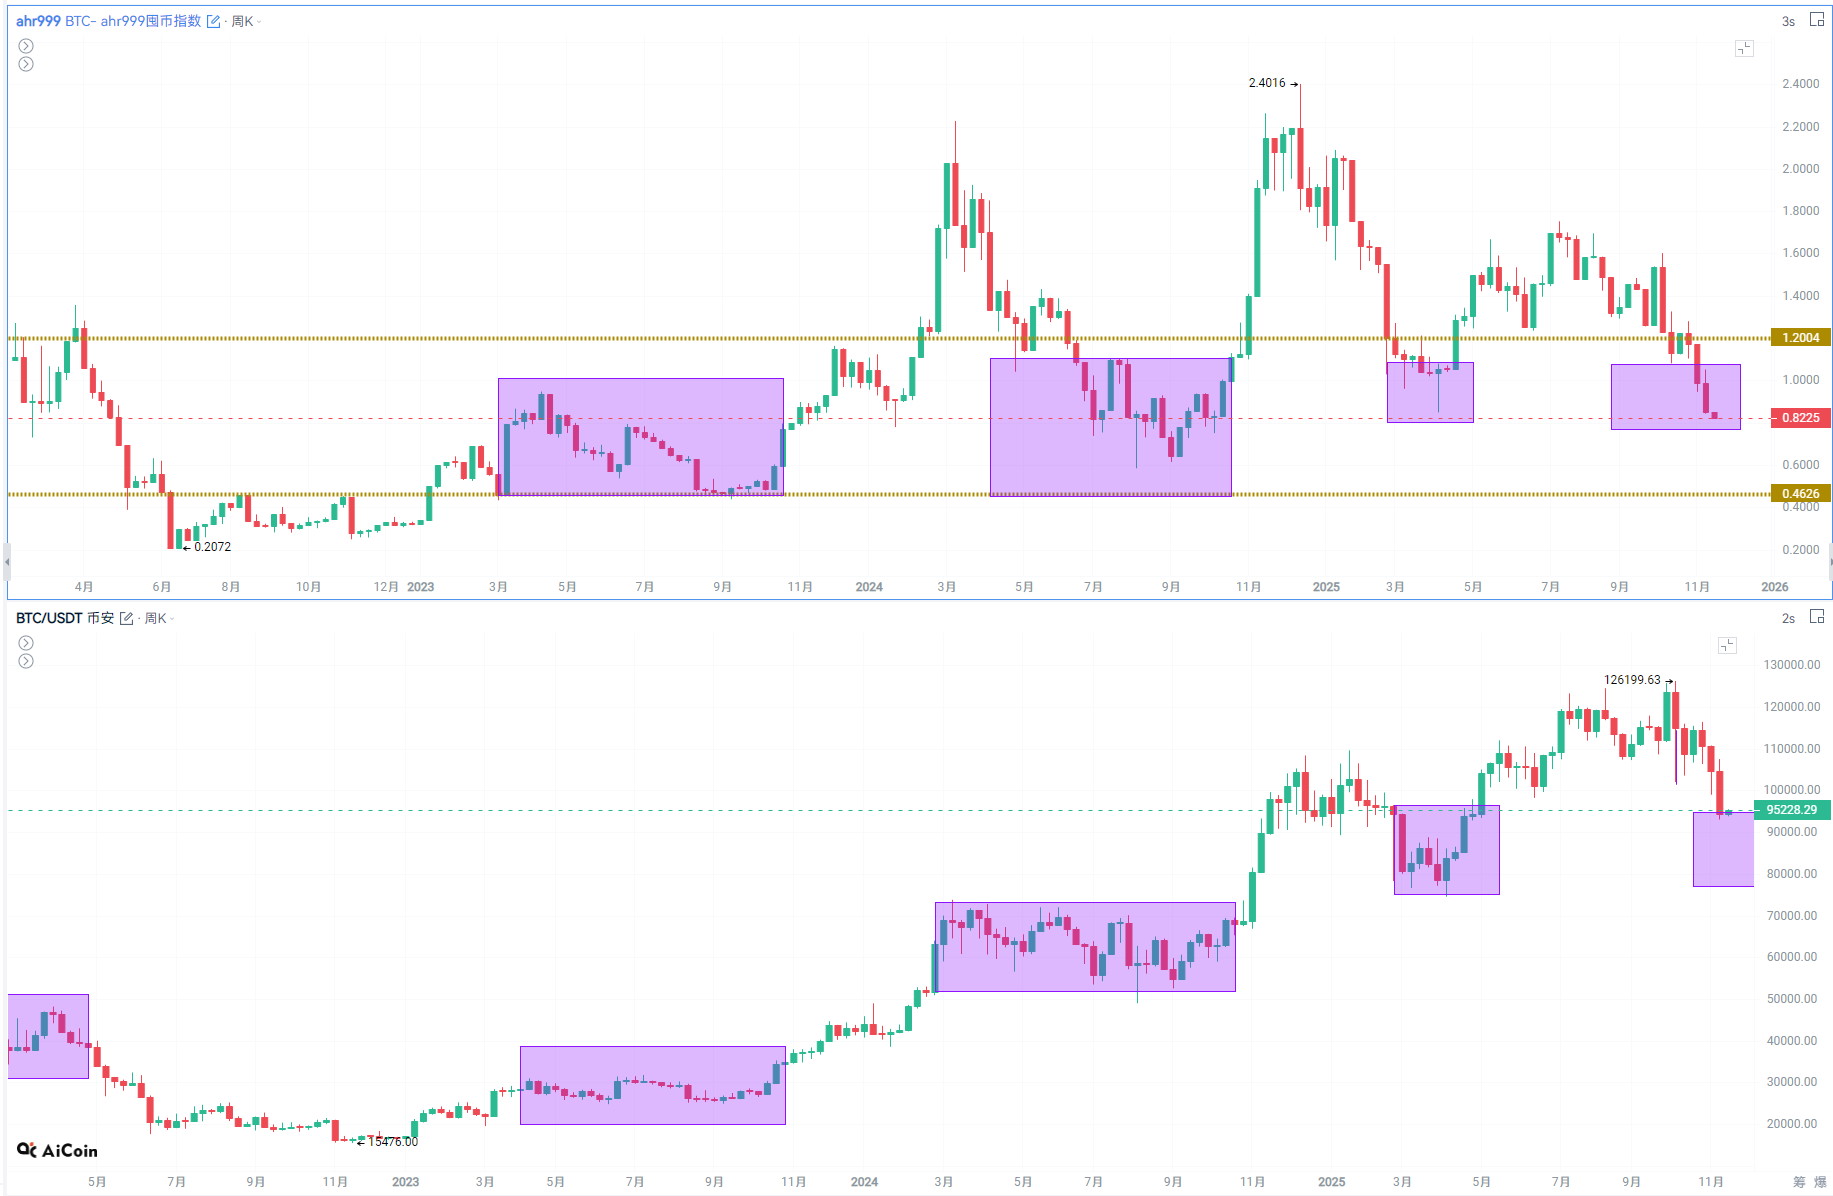
- The third HODLer Index reflects the attitude of medium- and long-term holders. It recently fell within the 0.45–1.2 range, which historically corresponds to a wide price fluctuation zone, without large-scale movement of long-term holdings.
- This means that despite the price decline, medium- and long-term investors remain stable, and the underlying market structure has not substantially deteriorated.
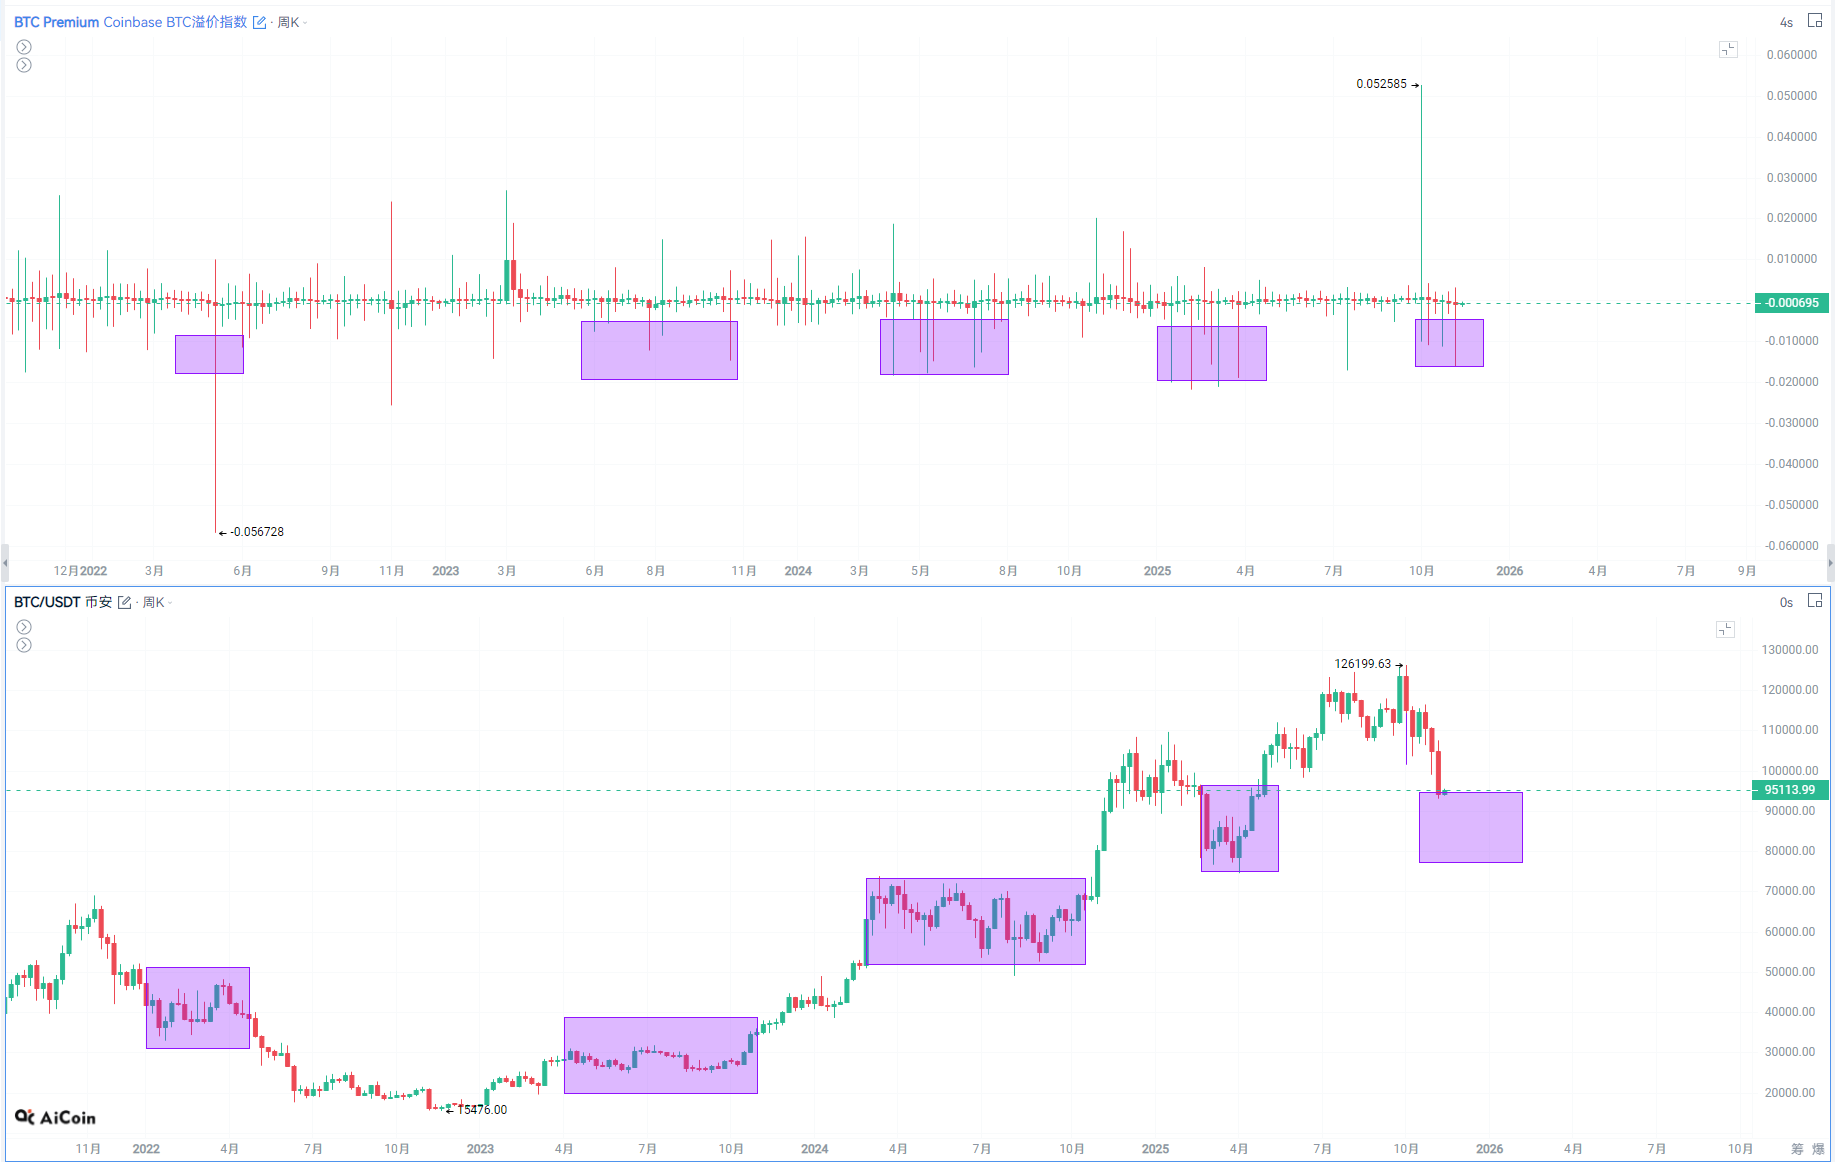
coinbase BTC premiumindexreflectsthe strengthof the US sessionand Asian session. If greater than0, the US session is strong;if less than0, the Asian session is strong.
The four major indicators come from sentiment, retail behavior, and long-term holding structure. The fact that they all reach extreme ranges at the same time is itself a rare signal resonance.
II. Why Are These Indicators Effective?
If we only judge whether the market is nearing its end based on "historical statistics," it is certainly not enough. But the reason why thesefourindicators are frequently effective at bottoms is because they reflect the most fundamental forces of the market.The market bottom is often not due to positive news, but because "everyone willing to sell has already sold."
- When sentiment is at extreme fear, marginal selling pressure is nearly exhausted. Further declines require new sellers, which are fewer, making stabilization more likely. The structure of the crypto market ensures this pattern repeats.
- The effectiveness of the Long/Short ratio also has deeper reasons.Retail investors are numerous but have little capital, and their sentiment is easily swayed by continuous volatility.
When retail investors are repeatedly shaken out during declines but are still forced to pile into longs, it often signals the market has reached an "emotional tipping point," not the start of a new trend. Statistically, this indicator's contrarian success rate is very high, not by coincidence, but as a typical manifestation of behavioral finance in the crypto market.
- As for the HODLer Index,it is more "fundamental" than sentiment and retail indicators.As long as long-term holdings remain stable, declines are unlikely to turn into a trend collapse. The current HODLer Index is still in a stable range, indicating that price adjustments are more driven by leverage, sentiment, and short-term funds, rather than panic exits by long-term capital. Therefore, the market has the conditions for wide fluctuations and gradual stabilization.
III. How This Time Is Strikingly Similar to Previous Bottoms
Comparing the current market with historical cycles, the structural similarity is astonishing.
- Whether it was the 2021 mining crash correction, the chain liquidations after the 2022 Luna event, the chaotic consolidation after the 2023 FTX collapse, or the violent volatility during the 2024 ETF sell-off period, the common features before and after the bottom are almost identical:continuous corrections, sentiment collapse, long liquidations, high-leverage shakeouts, and retail sentiment pushed to extremes.
This round of price action happens to reproduce these core features.
- Trading volume has shrunk significantly after the decline, indicating selling pressure is starting to wane;
- On-chain activity has dropped to bottom areas, which historically is a typical sign of "active selling ending, passive holding increasing";
- OTC trading volume has quietly increased, a usual move by large funds during panic periods;
- Stablecoin market cap has stabilized, indicating that off-market funds have not flowed out significantly. All these signs are highly consistent with historical bottoming areas.
In other words, the current market, in terms of structure, indicator combination, and sentiment pattern, is very close to previous BTC bottoms.
IV. Is This Really the "Countdown to the Bottom"?
Judging from the signals of the four major indicators, bitcoin is indeed approaching a relatively clear bottom area.But "approaching the bottom" does not mean "immediate reversal," nor does it mean there won't be a small further dip.
- A more accurate statement is:The marginal downside space has rapidly narrowed, and the probability of the market being in an "ending structure" is significantly higher than that of a "new round of accelerated downtrend."
- Sentiment indicators tell us that emotional selling is nearing its limit;
- The Long/Short ratio shows retail sentiment has been pushed to the extreme;The HODLer Index ensures the medium- and long-term holding structure has not been damaged.
- In addition, technicals are also showing typical "bottom-building characteristics":low-volatility sideways movement, long lower shadows, continuously shrinking volume, and active buying at deep dips.
The combination of these factors makes the current market state closer to a "chaotic phase before stabilization" rather than the "beginning of a trending decline."
V. The Three Most Important Signals to Watch Next
To determine when this round of decline truly ends, three signals are most decisive.
- First, whether the Fear and Greed Index can stay at extreme levels for several days. Historically, true bottoms are not formed by "one day of fear," but by sentiment staying cold at freezing point.
- Second, whether the Long/Short ratio retreats from its extreme value, which often means retail's extreme sentiment has been released and contrarian forces are building up.
- Third, whether the HODLer Index starts to rise. Once this indicator turns to "clear accumulation," it usually means long-term capital is officially taking over and the conditions for a new trend are in place.
If these three conditions overlap, it means the market has truly completed bottom confirmation.
VI. The Trend Remains, but the Cycle Is Nearing Its End
Based on the current three major indicators, market structure, and historical patterns, we can make a relatively robust judgment:
Bitcoin is very likely already in the final stage of this round of decline. The extremity of sentiment, the tilt of retail behavior, and the stability of the holding structure give the market the conditions for gradual stabilization; the downside space is narrowing, while the conditions for a rebound are accumulating.
This is not a call for reversal, but means the market is moving from "sharp decline" to a phase of "digestion and repair." When sentiment extremes meet stable holdings, and retail extremes meet large capital accumulation, the market is usually not far from bottoming out.