Bitget App
Trade smarter
Buy cryptoMarketsTradeFuturesEarnSquareMore
Solana (SOL) Beaten Down: Is a Recovery Rally on the Horizon?

Solana (SOL) Beaten Down: Is a Recovery Rally on the Horizon?

CryptodailyCryptodaily2025/11/10 16:00
By:Laurie Dunn

One top layer 1 altcoin that has been down as much as 40% in this corrective phase is Solana (SOL). Whenever a rally begins the price is slammed down hard. Is a full-on recovery going to take place any time soon?

Is the $SOL price being suppressed?

Each time it looks like $SOL is going to break out, it seems that cartloads of $SOL are sent from Binance to Wintermute and heavy selling begins, forcing the price back down. Could this be a ploy on behalf of certain institutions to keep the price low before the SOL spot ETFs are approved?

$SOL price follows descending channel 
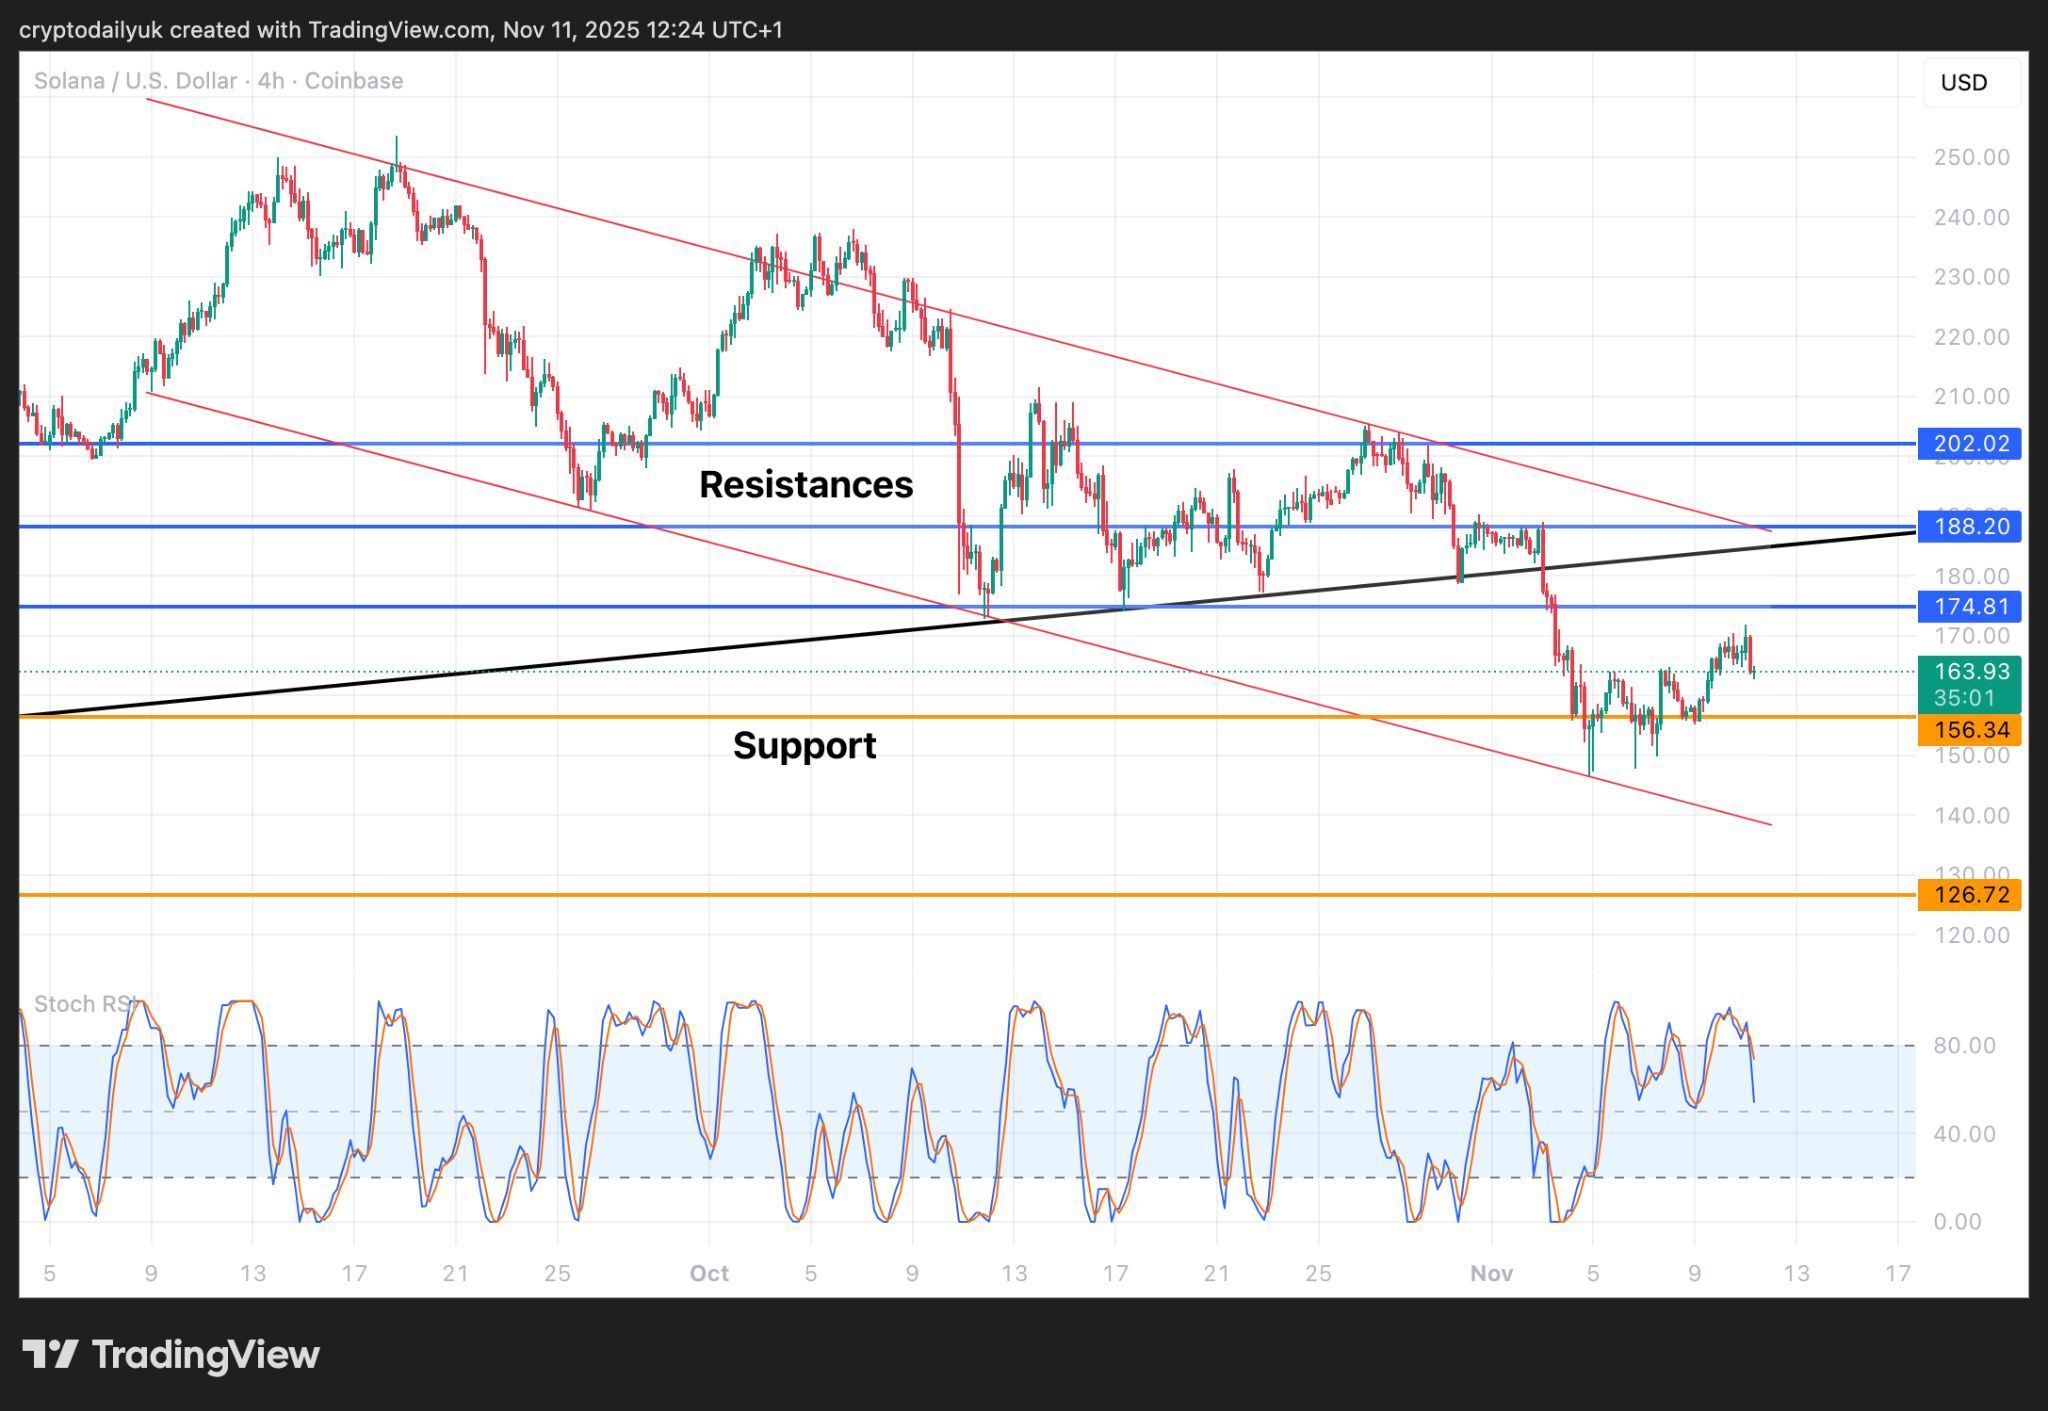
Solana (SOL) Beaten Down: Is a Recovery Rally on the Horizon? image 0

Source: TradingView

The short-term time frame shows that the $SOL price is still descending within a channel and has been doing so since mid-September. In addition, the price has fallen below supports, turning them into resistance, and is now below a major ascending trendline which started to form in April this year. 

The current price action suggests that the price is likely to come back down to the $156 horizontal support which has been a strong level so far. If this level fails, the next support is either the bottom of the channel or the major $127 horizontal level.

A base forming for $SOL big rally?
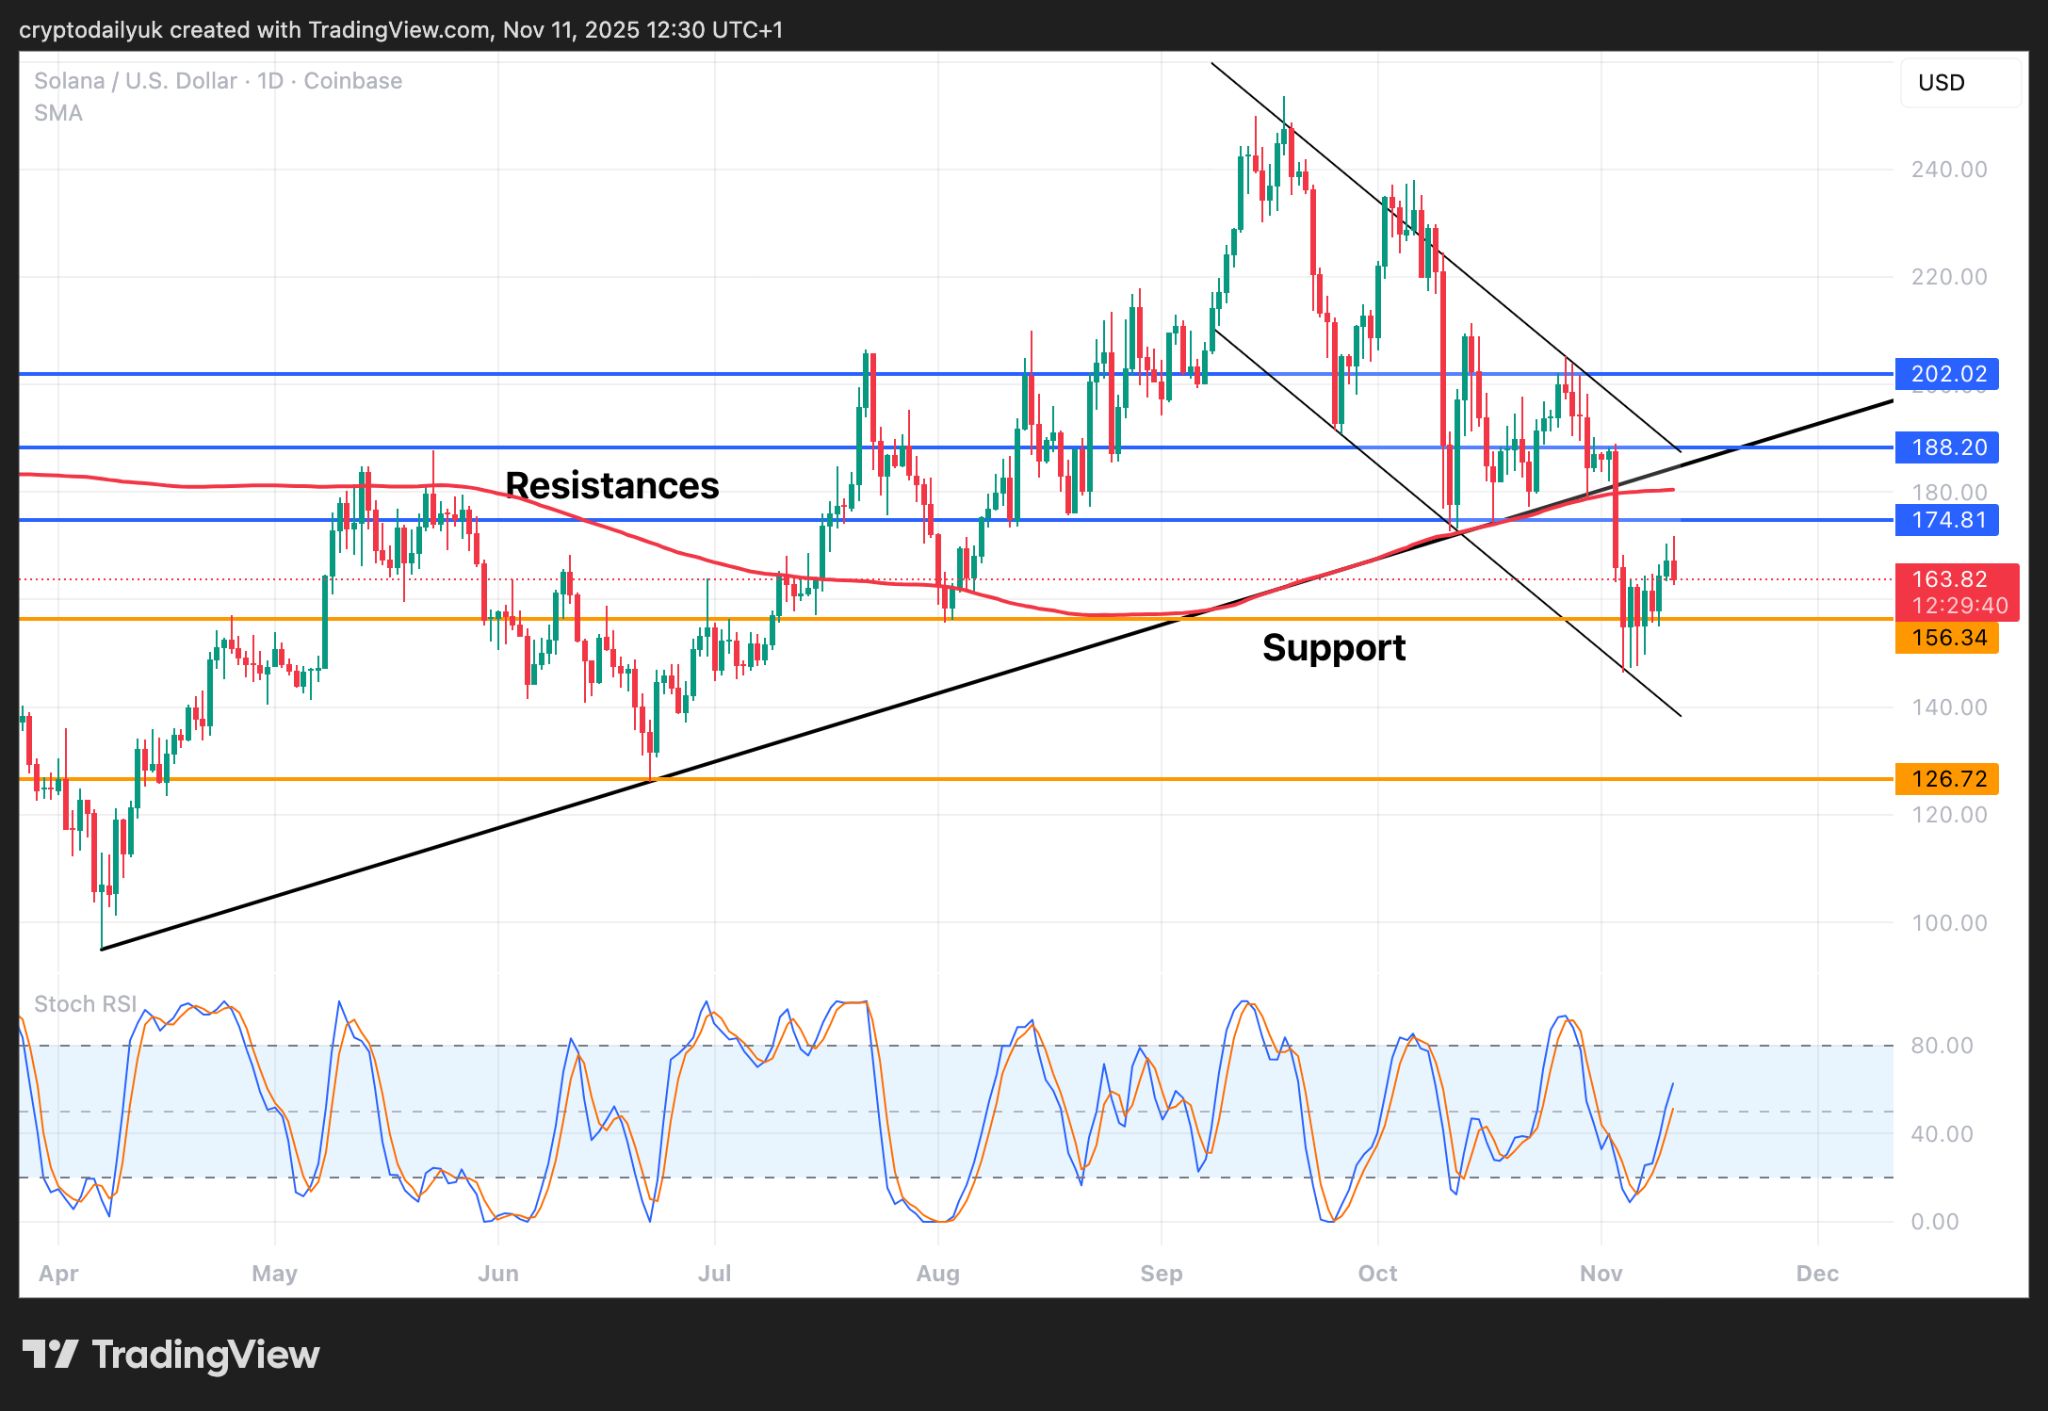
Solana (SOL) Beaten Down: Is a Recovery Rally on the Horizon? image 1

Source: TradingView

The main takeaway in the daily chart is that it does rather look like the $SOL price is now setting in a bottom. $156 is a strong horizontal support line and testament to this are the candle wicks that have shot below, with one of them tagging the bottom of the descending channel. 

This is all good news for a recovery, so the bulls just need to make sure that this current corrective impulse does not fall and confirm below the horizontal support. 

Getting back above the 200-day SMA and the major trendline are two major targets. The top of the channel could also coincide with the major trendline and horizontal resistance, making this a very difficult barrier for the bulls to overcome.

3 stand-out elements in weekly time frame
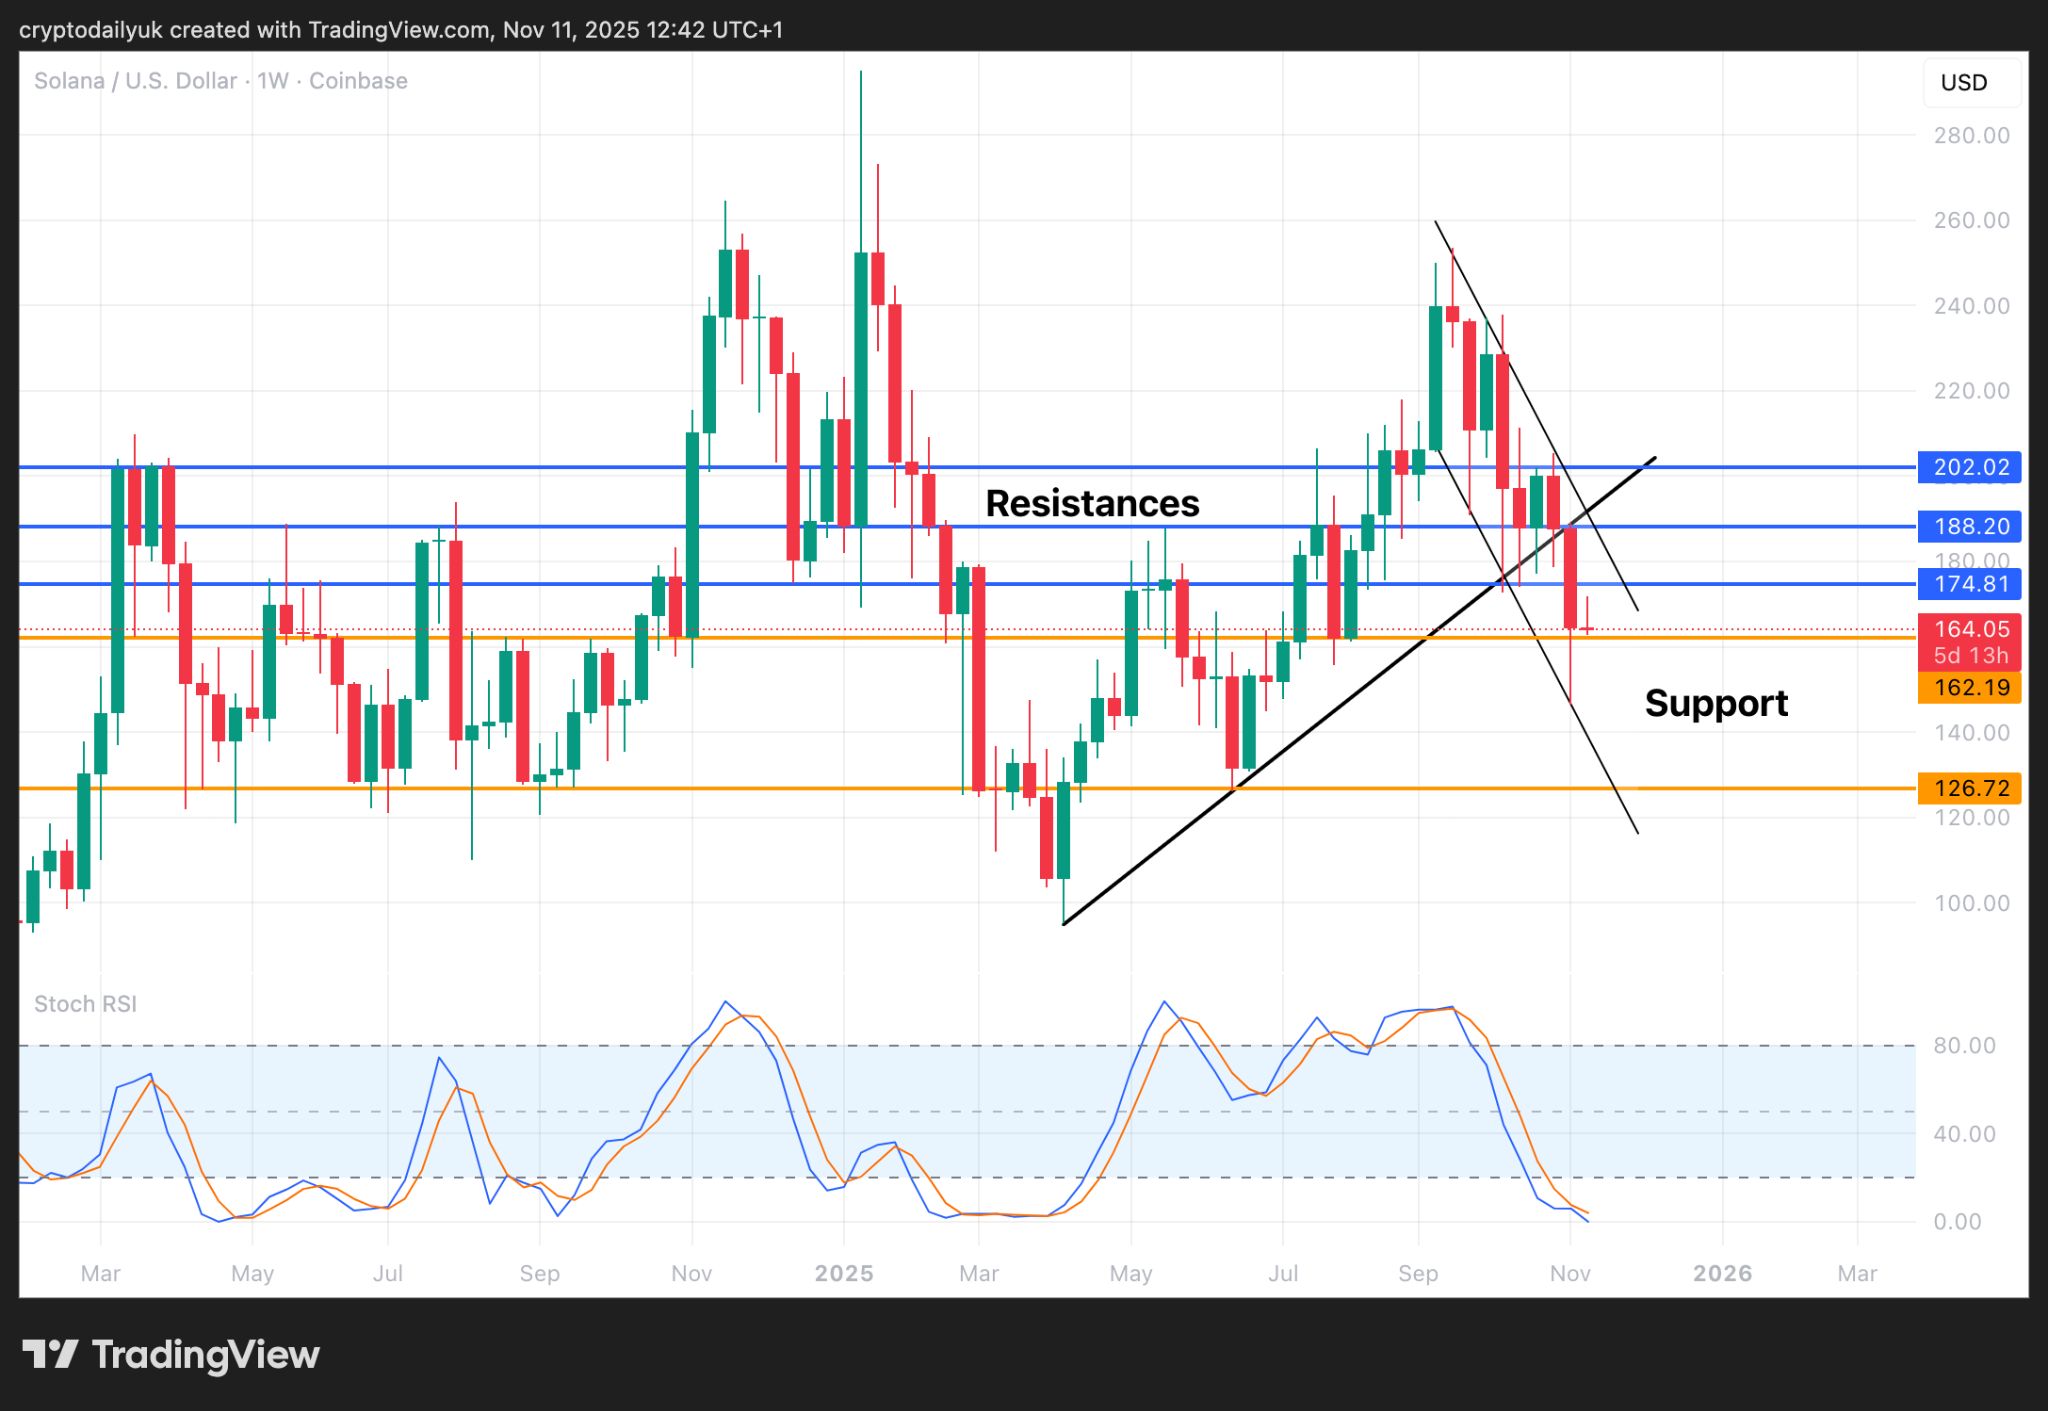
Solana (SOL) Beaten Down: Is a Recovery Rally on the Horizon? image 2

Source: TradingView

In the weekly time frame there are three stand-out elements. The first, and a bearish one, is that a full and long candle body opened below the ascending trendline and another one has also opened below. The second element, this time bullish, is that the long bearish candle retested the bottom of the channel, providing a third confirmation of the lower trendline of this pattern. Finally, the fourth element, also bullish, and perhaps the most important of all, is that the Stochastic RSI indicator lines are touching the bottom. When they cross back up, there is the possibility of a rally of similar proportions as the last time they crossed up. This resulted in a 167% rally. Yes, a recovery is very much on the horizon.

0

Disclaimer: The content of this article solely reflects the author's opinion and does not represent the platform in any capacity. This article is not intended to serve as a reference for making investment decisions.

PoolX: Earn new token airdrops
Lock your assets and earn 10%+ APR
Lock now!

You may also like

Fed Split: Should They Prioritize Fighting Inflation or Supporting Employment?

- Fed policymakers remain divided over prioritizing inflation control or labor-market support, with hawks like Bostic urging rate stability until inflation nears 2%. - Dovish officials argue slowing job growth (29,000 monthly payrolls in late 2024) demands rate cuts to sustain economic momentum despite inflation risks. - Tariff adjustments and delayed economic data complicate decisions, with Treasury's import relief measures facing criticism for potential inflationary rebound. - Looming student loan tax ch

Bitget-RWA2025/11/12 17:46
Fed Split: Should They Prioritize Fighting Inflation or Supporting Employment?

YFI has dropped 7.68% over the past week during a period of heightened volatility and ongoing downward momentum

- YFI fell 7.68% weekly to $4747, reflecting ongoing bearish sentiment amid broader market weakness. - Technical indicators show bearish alignment (EMA/SMA below price) and key support at $4500–$4600 as critical near-term levels. - Historical backtesting reveals limited post-crash recovery potential, with buy-and-hold win rates between 48-62% after 10%+ drops. - YFI remains vulnerable to further declines without a significant shift in market dynamics or bullish catalysts.

Bitget-RWA2025/11/12 17:46

Polkadot News Today: "Why Presale Investors Prefer BlockchainFX's AOFA License Instead of Polkadot or Polygon"

- BlockchainFX secures AOFA license, boosting investor confidence and attracting whale capital amid market shifts toward early-stage projects. - Its $11M+ presale offers tokens at $0.03 with a 50% bonus code, contrasting with slower growth curves of Polkadot and Polygon due to larger market caps. - The project's hybrid model combines regulatory credibility, utility-driven beta platform, and staking rewards, positioning it as a "super app" for multi-asset trading. - Aggressive ROI projections and $500K Glea

Bitget-RWA2025/11/12 17:28
Polkadot News Today: "Why Presale Investors Prefer BlockchainFX's AOFA License Instead of Polkadot or Polygon"

BCH Stock - 0.70% Potential Gain as Governance Improves

- BCH fell 0.02% in 24 hours and 5.51% monthly, with Goldman Sachs maintaining a Neutral rating and 0.70% upside target. - Institutional holdings showed mixed activity, including a 289.93% stake reduction by Baillie Gifford, while governance reforms aimed to enhance transparency. - Projected 19.4% revenue growth and $8.49 non-GAAP EPS signal modest recovery, though weak loan growth and bearish put/call ratio (4.11) highlight risks.

Bitget-RWA2025/11/12 17:28