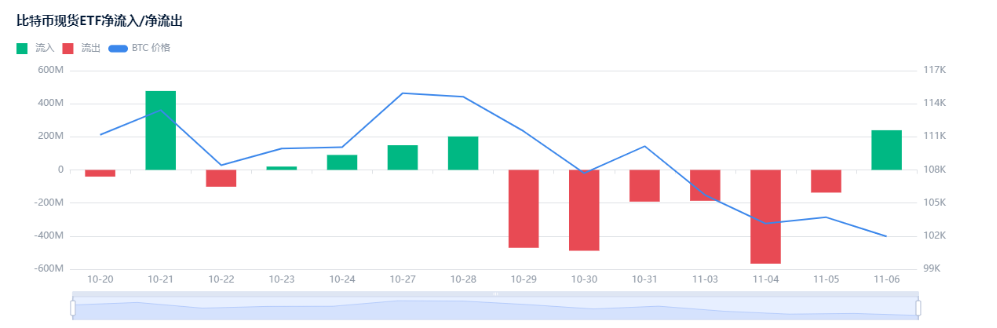
The bitcoin market has never faced a dual test like today, simultaneously experiencing both an internal cycle transition and an external liquidity crisis. A Citi report points out that the liquidation event in the crypto market on October 10 may have damaged investors’ risk appetite. Inflows into US spot ETF funds have noticeably slowed over the past few weeks.
On-chain indicators show that bitcoin whales are gradually decreasing, while the holdings of smaller retail wallets are increasing. Funding rates are also declining, reflecting insufficient demand for leverage.
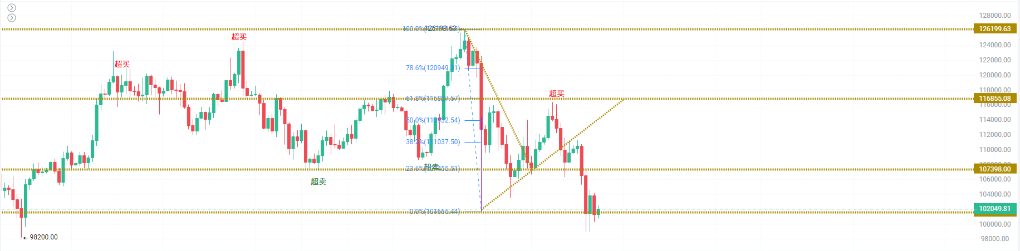
From a technical perspective, bitcoin is now trading below its 200-day moving average, which may further suppress demand.

I. Market Status: Bitcoin Under Deep Correction
Since hitting a historic high in early October, the price of bitcoin has dropped by about 20%, entering a period of deep correction. This adjustment occurred at a sensitive moment when the end of bitcoin’s “four-year cycle” coincided with the ongoing US government shutdown liquidity crisis, intensifying both the depth and duration of the correction.
● The “Black Friday” liquidation event on October 10 further damaged market risk appetite. The decline in funding rates also reflects insufficient demand for leverage, indicating overall market weakness.
● US spot bitcoin ETF inflows have significantly decreased in the past few weeks, which was unexpected by the market.
II. Cycle Theory: The Historical Pattern and Current Changes of the Halving Mechanism
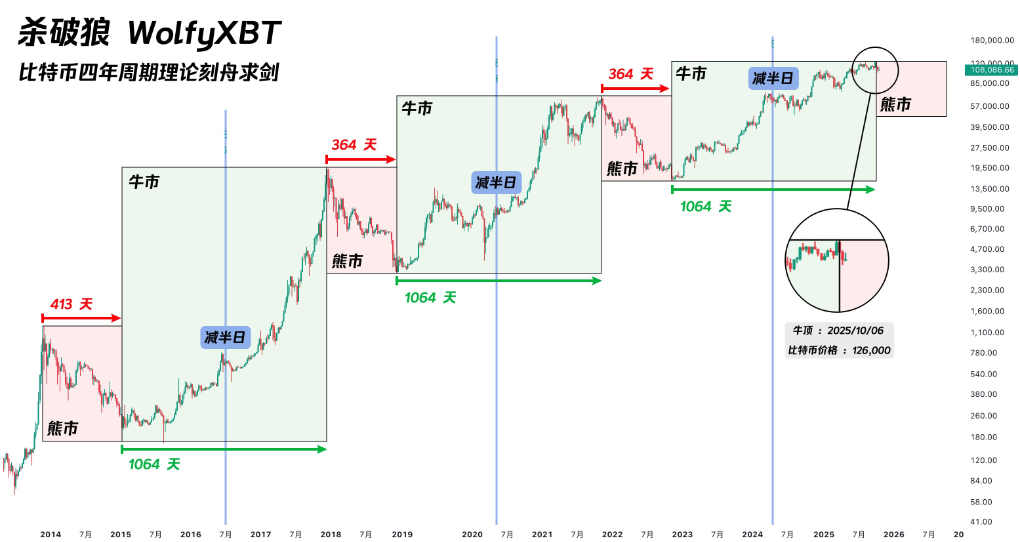
Bitcoin’s four-year cycle theory is based on its halving mechanism. Every time 210,000 blocks are mined (about four years), the block reward for miners is halved, reducing the supply of new bitcoin. This mechanism creates a predictable supply shock, which has historically triggered cyclical price surges.
Looking back at history, bitcoin’s four-year cycle shows astonishing regularity:
● After the first halving in November 2012, the price of bitcoin soared from $12 to about $1,100
● After the second halving in July 2016, the price rose from about $650 to nearly $20,000
● After the third halving in May 2020, the price climbed from about $8,700 to over $67,000
● In April 2024, bitcoin completed its fourth halving, with block rewards dropping from 6.25 BTC to 3.125 BTC
About a dozen months after each halving, bitcoin reaches a cyclical high, followed by a bear market correction. It has now been 18 months since the April 2024 halving, placing us in the sensitive tail end of the cycle.
III. Market Evolution: Is the Traditional Cycle Theory Failing?
Some research institutions point out that the bitcoin market may be gradually breaking away from the typical four-year cycle.
● Bitwise mentioned in its long-term bitcoin research report that as institutional investors continue to enter the market and spot ETFs provide new demand channels, the market structure is becoming more mature, and price fluctuations may no longer strictly follow the traditional four-year rhythm.
At the same time, the impact of this 2024 halving on the supply side has clearly weakened compared to earlier cycles.
● According to data from Glassnode and Galaxy Research, this halving reduced bitcoin’s annualized issuance rate from about 1.7% to about 0.85%. However, since about 19.7 million bitcoins have already been mined (out of a total of 21 million), the proportion of new issuance in the overall supply is now very limited, and its marginal impact on the market is diminishing.
This means that market pricing now relies more on the structure of capital inflows (especially from institutions and long-term holders), rather than being mainly driven by changes in new supply.
IV. Whale Sell-Off: A Typical Feature at the End of the Cycle
Citi’s latest report reveals the key driving force behind the current correction: on-chain data shows that bitcoin “whales” (large holders) are gradually decreasing, while the holdings of small “retail” wallets are increasing.
● This phenomenon is highly consistent with the four-year cycle theory, meaning that at the end of the cycle, smart money typically sells bitcoin to new entrants. Since August, whales have cumulatively sold 147,000 bitcoins, worth about $16 billion.
● Entities holding more than 10,000 bitcoins are clearly in a “distribution” phase. Almost all long-term holders are currently in profit and are taking large-scale profits.
● Bitwise’s Head of Research Europe, André Dragosch, pointed out that these whales “believe in the four-year halving cycle and therefore expect that bitcoin has already reached the peak of this cycle.”
V. Government Shutdown: The “Siphon” of Liquidity
The more direct catalyst for the current bitcoin correction comes from the liquidity crisis triggered by the US government shutdown. The rapid expansion of the US Treasury General Account (TGA) balance is siphoning a large amount of liquidity from the market.
● At the end of October 2025, the TGA balance exceeded $1 trillion for the first time, reaching a nearly five-year high since April 2021. In the past few months, the TGA balance has soared from about $300 billion to $1 trillion, draining over $700 billion in liquidity from the market.
● The expansion of the TGA balance has triggered widespread tension in the money market. The upper end of the overnight repo rate once reached 4.27%, much higher than the Fed’s 3.9% excess reserve rate and the 3.75%-4.00% federal funds target range.
The SOFR rate has also risen significantly, indicating a clear tightening of market liquidity.
● Citi’s report specifically emphasizes that cryptocurrencies are “very sensitive” to banking liquidity conditions. Research shows that weekly price changes in bitcoin are synchronously correlated with changes in US bank reserves, and declines in bank reserves are often accompanied by weak bitcoin performance.
This sensitivity makes bitcoin the earliest and most sensitive victim of liquidity tightening.
VI. Market Turning Point: Potential Catalysts for Liquidity Release
● Despite the current severe situation, the root of the crisis is also the key to a potential market turnaround. Since the government shutdown is the main driver of liquidity tightening, once the shutdown ends, the US Treasury will begin to consume its massive TGA cash balance, releasing hundreds of billions of dollars in liquidity into the economy.
● Previously, Goldman Sachs predicted that the government shutdown is most likely to end around the second week of November. Prediction markets show about a 50% chance that the government will reopen before mid-November, with less than a 20% chance of dragging past Thanksgiving.
● Once the US government restarts, the release of pent-up liquidity could trigger a massive rush into risk assets. This liquidity release could be equivalent to “stealth quantitative easing”, a scenario similar to early 2021, when the accelerated depletion of the US Treasury’s cash balance drove a sharp rise in the stock market.
● Once the government reopens, the release of pent-up liquidity coinciding with the year-end could drive a surge in bitcoin, small-cap stocks, and almost all non-AI assets that are sensitive to liquidity.
The worse the current situation, the more reserve liquidity will be released in the medium term. The TGA balance is currently close to $1 trillion, and once it starts to be consumed, the scale of liquidity released will be unprecedented. This sudden return of liquidity could become a catalyst for a strong rebound in risk assets such as bitcoin.