Bitcoin Price Below 100K: Is This the Start of a Deeper Crash?

Bitcoin Price Suffers Another Major Drop
Bitcoin is once again testing traders’ nerves. The leading cryptocurrency fell sharply from $116,000 to around $107,300, marking a significant 3% decline within 24 hours. This sell-off follows a series of lower highs since mid-October, reinforcing concerns that Bitcoin’s bullish momentum may be losing steam.
The daily chart shows Bitcoin struggling to stay above the 200-day moving average (SMA), currently sitting near $109,800. This key line has served as a dynamic support throughout 2025, and a decisive break below it could accelerate bearish sentiment.
Bitcoin Price Analysis: Key Levels to Watch
The $BTC/USD daily chart paints a clear picture of fragility. After multiple failed attempts to reclaim $111,000–$112,000, sellers have regained control. Momentum indicators are also turning bearish:
- RSI (Relative Strength Index) sits near 40, signaling fading buying pressure.
- MACD lines remain below zero, hinting that momentum could continue to tilt downward.
- The 50-day MA is trending below the 200-day SMA, a potential bearish crossover formation in progress.
BTC/USD 1-day chart - TradingView
If $Bitcoin closes decisively below $107,000, a critical psychological threshold, a cascade of stop-loss orders could trigger further downside.
Short-Term Bitcoin Prediction If Bitcoin Breaks Below 107K
If the 107K support gives way, the next key zones to watch are:
| $106,000 | Minor horizontal support from June swing lows | ⚠️ High |
| $100,000 | Psychological round number and prior breakout level | 🔥 Very High |
| $92,800 | Historical confluence from February consolidation | ⚠️ Moderate |
| $75,000 | 2024 support floor and long-term bullish defense line | 🧊 Low (unless panic selling) |
A drop toward $100K would confirm a medium-term correction phase, wiping out nearly all gains made during the summer rally. A breach below $92,800 could then open the door for a deeper capitulation toward $75K, where Bitcoin last found strong buying interest in early 2024.
Bullish Bitcoin Prediction: Can Bitcoin Recover from Here?
For bulls, hope isn’t entirely lost. Bitcoin remains inside a long-term ascending channel and is still above last year’s average range. To invalidate the bearish outlook, BTC must reclaim $111,000, followed by a daily close above $116,000 to reestablish higher highs.
Until then, the market remains vulnerable. The technical structure suggests traders should monitor the $107K–$100K zone closely, as any breakdown could trigger volatility across the broader crypto market.
Disclaimer: The content of this article solely reflects the author's opinion and does not represent the platform in any capacity. This article is not intended to serve as a reference for making investment decisions.
You may also like
Bitcoin May Face "The Last Drop": The Real Scenario of Liquidity Squeeze Is Unfolding
Bitcoin may be in the "final drop" stage of this correction. At the intersection where fiscal spending resumes and the next interest rate cut cycle begins, a new liquidity cycle will also be restarted.

Galaxy Research Report: What Is Driving the Rise of the Doomsday Vehicle Zcash?
Regardless of whether ZEC’s price strength can be sustained, this round of market rotation has successfully forced the market to reassess the value of privacy.
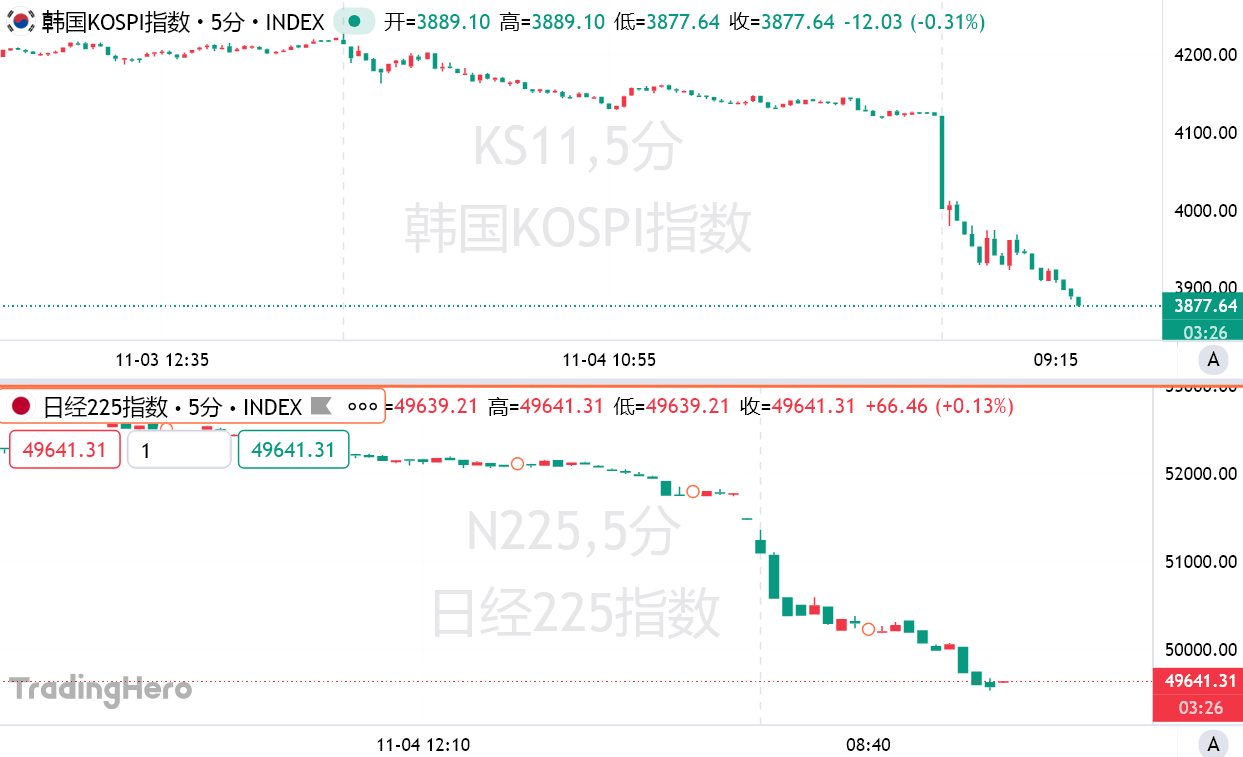
Asian stock markets plunge with circuit breakers triggered; Korea hits circuit breaker during trading, Nikkei falls below the 50,000 mark
Wall Street warns: This is just the beginning, and the panic triggered by the bursting of the AI bubble has only just started.
Only 0.2% of traders can exit at the bull market peak: The art of "smart exits" in the crypto cycle