BTC Market Pulse: Week 45
In sum market remains fragile as stabilized technical momentum contrasts with weakening capital inflows and fading profitability. ETF outflows and slowing institutional demand highlight a lack of sustained liquidity support, while profit/loss dynamics continue to soften.
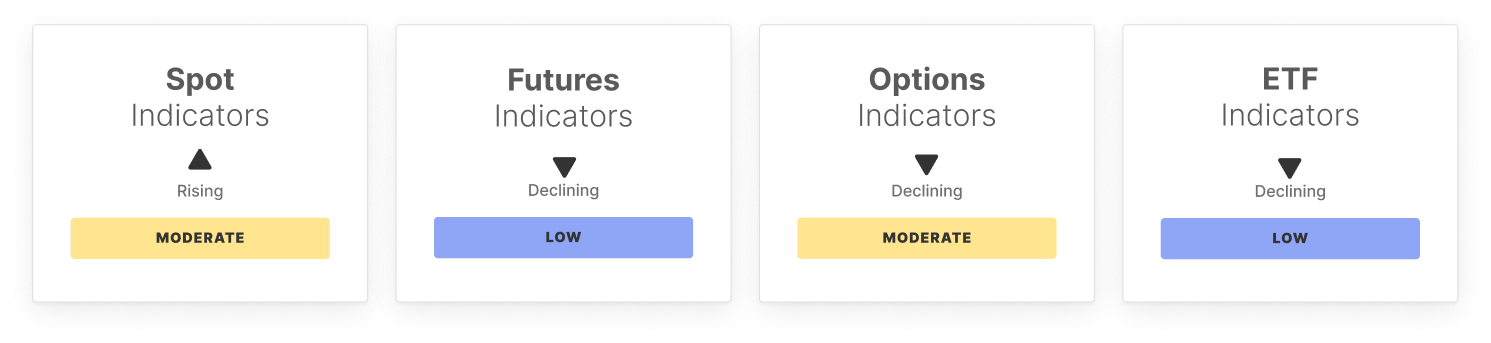
Bitcoin remained steady over the past week but failed to break above the cost basis of short-term holders. Momentum showed modest improvement and volatility stayed contained.
The RSI rose to 55.7, showing firmer momentum without overbought risk. Spot CVD strengthened as sell pressure eased, though spot volumes fell 11.4% to $10.9B, signaling lighter activity.
In derivatives, funding payments softened and futures CVD declined to -$789.6M, indicating renewed sell pressure. Options OI fell 7.7% to $49.2B, while the Volatility Spread widened to -6.45%, and the 25-Delta Skew rose to 9.17%, reflecting increased hedging demand.
ETF flows turned negative with $617.2M in outflows, pointing to profit-taking and softer institutional demand, though volumes held steady at $24.6B. The MVRV ratio eased to 2.05, implying reduced unrealized profits and selling pressure.
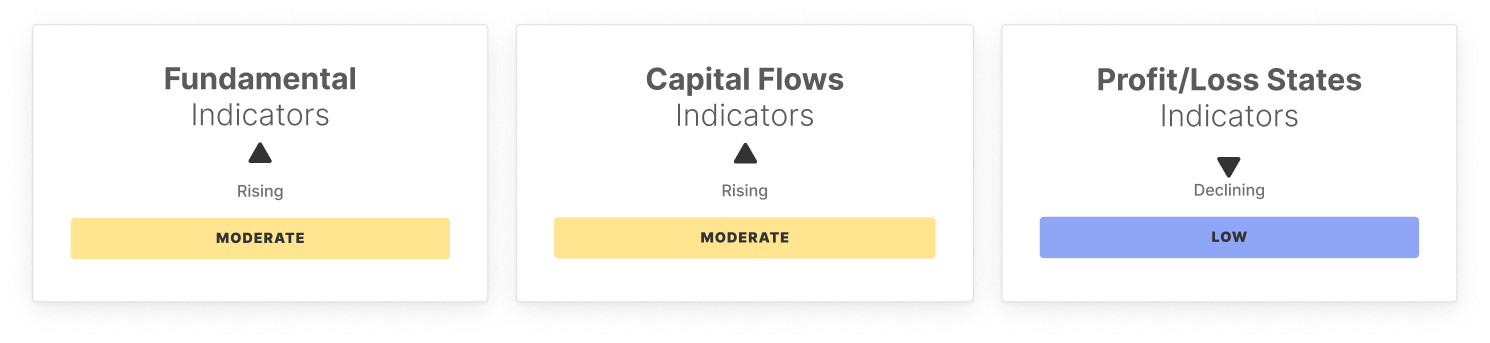
On-chain, active addresses edged up to 687K, while transfer volumes surged 27.6% to $11.1B, showing stronger capital flow. Fee volumes dipped slightly, and Realized Cap Change rose to 3.5%, consistent with steady accumulation.
Structurally, short-term holder supply rose to 18.2%, and Hot Capital Share climbed to 35.4%, reflecting moderate speculative interest. The Percent Supply in Profit fell to 84.0%, below its low band, a pattern typical of accumulation.
The NUPL slipped to -2.1%, showing persistent unrealized losses, while the Realized Profit-Loss Ratio improved to 1.7, hinting at selective profit-taking as confidence rebuilds.
In sum market remains fragile as stabilized technical momentum contrasts with weakening capital inflows and fading profitability. ETF outflows and slowing institutional demand highlight a lack of sustained liquidity support, while profit/loss dynamics continue to soften. On-chain accumulation persists but lacks conviction, suggesting capital rotation rather than fresh demand. In the absence of stronger inflows or renewed liquidity, the market risks extending into a longer consolidation, or even a drawn-out bear phase, as confidence rebuilds slowly across participants.
Off-chain Indicators
On-chain Indicators
🔗 Access the full report in PDF

Don't miss it!
Smart market intelligence, straight to your inbox.
Subscribe now- For on-chain metrics, dashboards, and alerts, visit Glassnode Studio
Please read our Transparency Notice when using exchange data .
Disclaimer: The content of this article solely reflects the author's opinion and does not represent the platform in any capacity. This article is not intended to serve as a reference for making investment decisions.
You may also like
That summer, I sniped altcoins on DEX and made 50 million dollars.
Starting from just $40,000, we ultimately sniped more than 200 altcoins across over 10 different blockchains.
From Balancer to Berachain: When Chains Hit the Pause Button
A single vulnerability exposes the conflict between DeFi security and decentralization.
Berachain: All funds stolen due to the vulnerability have been recovered.
The Butterfly Effect of the Balancer Hack: Why Did $XUSD Depeg?
Long-standing issues surrounding leverage, oracle construction, and PoR transparency have resurfaced.