Bitget App
Trade smarter

BTC Volatility Review (October 6 - October 27)
SignalPlus2025/10/28 22:41
Show original
By:SignalPlus
Key indicators (4:00 PM Hong Kong time on October 6 -> 4:00 PM Hong Kong time on October 27): BTC/USD -6.4...

Key Metrics (4:00 PM HKT, October 6 -> 4:00 PM HKT, October 27):
- BTC/USD -6.4% ($123,450 -> $115,600)
- ETH/USD -7.5% ($4,540 -> $4,200)
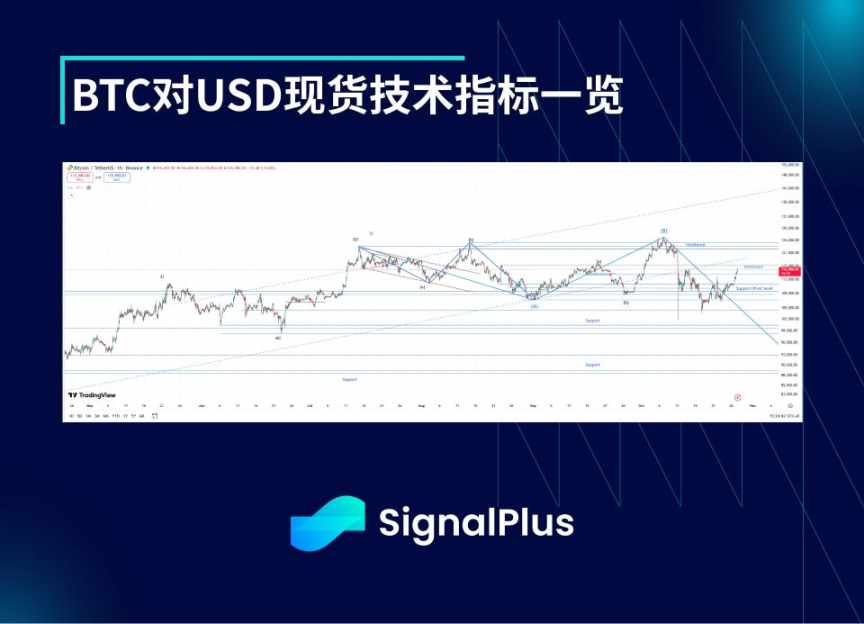
- The market has clearly established a B wave high around $126,000. Since then, for most of the past two weeks, the price has been testing the support range of $109,000 to $104,000, but has now rebounded to the resistance zone of $114,500 to $117,500. Our view is that this is likely the second sub-wave in a major five-wave decline that could take prices below $95,000. However, given the difficulty in precisely assessing the impact of the flash crash on October 11, there is a possibility of entering a more complex corrective phase, which may retest the B wave high (and then correct downward again). Support below lies at $109,000, followed by $107,000 and then the $105,000 to $104,500 range; on the upside, the initial key resistance is at $117,500, with stronger resistance in the $121,000 to $125,000 area.
Market Themes
- The past few weeks have been turbulent for cryptocurrencies and even global stock markets. The surge in risk assets at the beginning of October (“Uptober”) was challenged when faced with reality: Trump tweeted before talks with China, threatening to reimpose a 155% tariff if no progress was made on the agreement by November 1. This triggered significant risk-off volatility, with cryptocurrencies as victims. In the early hours of October 11 HKT, during a period of low liquidity, aggressive liquidations were triggered, with Binance at the center of the event. BTC instantly flash crashed to a low of $102,000 (having reached as high as $123,000 earlier that day), while some altcoins experienced even more extreme volatility. In the following days and week, order book liquidity dropped significantly, causing realized volatility to remain high until macro risks stabilized and liquidity finally returned to the market.
- Looking ahead, Trump and President Xi are finally scheduled to meet face-to-face in Korea on October 30, and the main negotiators from both sides have communicated on key issues, with the market seemingly preparing for an agreement. Risk assets opened strongly this week, with BTC rebounding above $115,000. The Federal Reserve is expected to cut rates by another 25 basis points, and based on last Friday’s positive CPI data, the committee has no reason to deviate from the dot plot expectations of the last meeting. With quantitative tightening also expected to end soon (JPMorgan will hold a conference call this week), these factors combined with a potential trade agreement could lay the foundation for a rally in risk assets in the coming weeks, especially as market positioning feels lighter after this month’s risk-off volatility.
BTC Implied Volatility
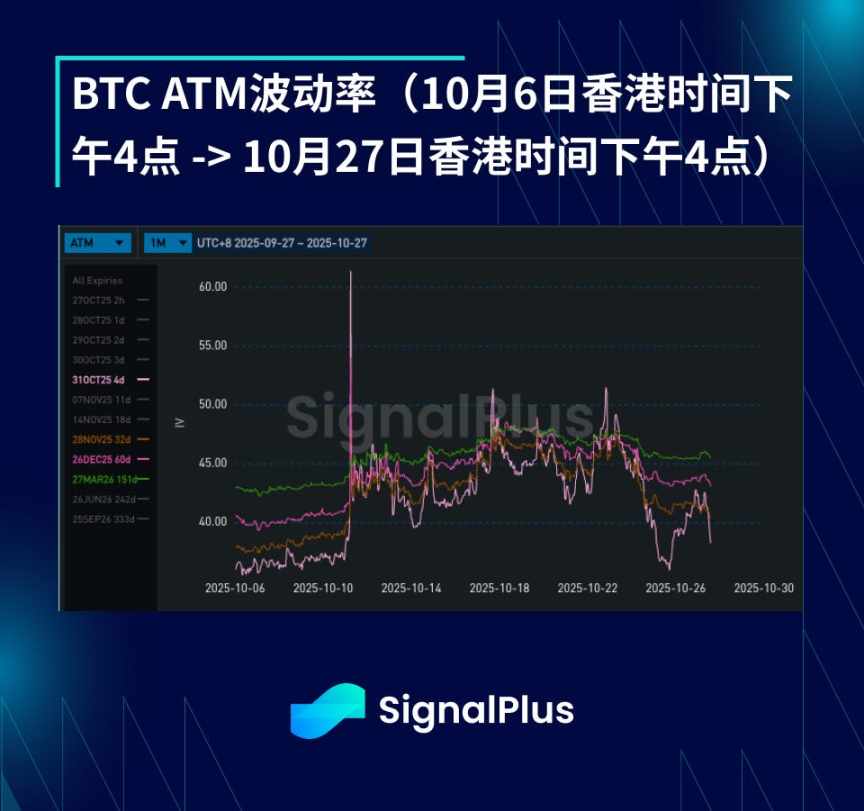
- Implied volatility has fluctuated widely over the past few weeks. After the liquidation event on October 11, market volatility rebounded sharply from the lows, with realized volatility rising from just over 20% to 50%. For the next 10 days, due to persistently thin order book liquidity, realized volatility remained above 40%. However, since the price has still been hovering in the broad $100,000 to $125,000 range since May, demand for options has been fairly muted, so implied volatility did not “overshoot” relative to realized volatility as much as we have seen in similar past episodes.
- The term structure of implied volatility initially flattened, as short-term volatility surged, mainly due to higher realized volatility and increased demand for gamma. But as order book liquidity returned and spot prices climbed back above $110,000 to $112,000, we saw renewed selling pressure at the front end of the curve, though the term premium persists, with longer-dated volatility still higher than pre-event levels, naturally making the term structure steeper.
BTC Skew / Kurtosis
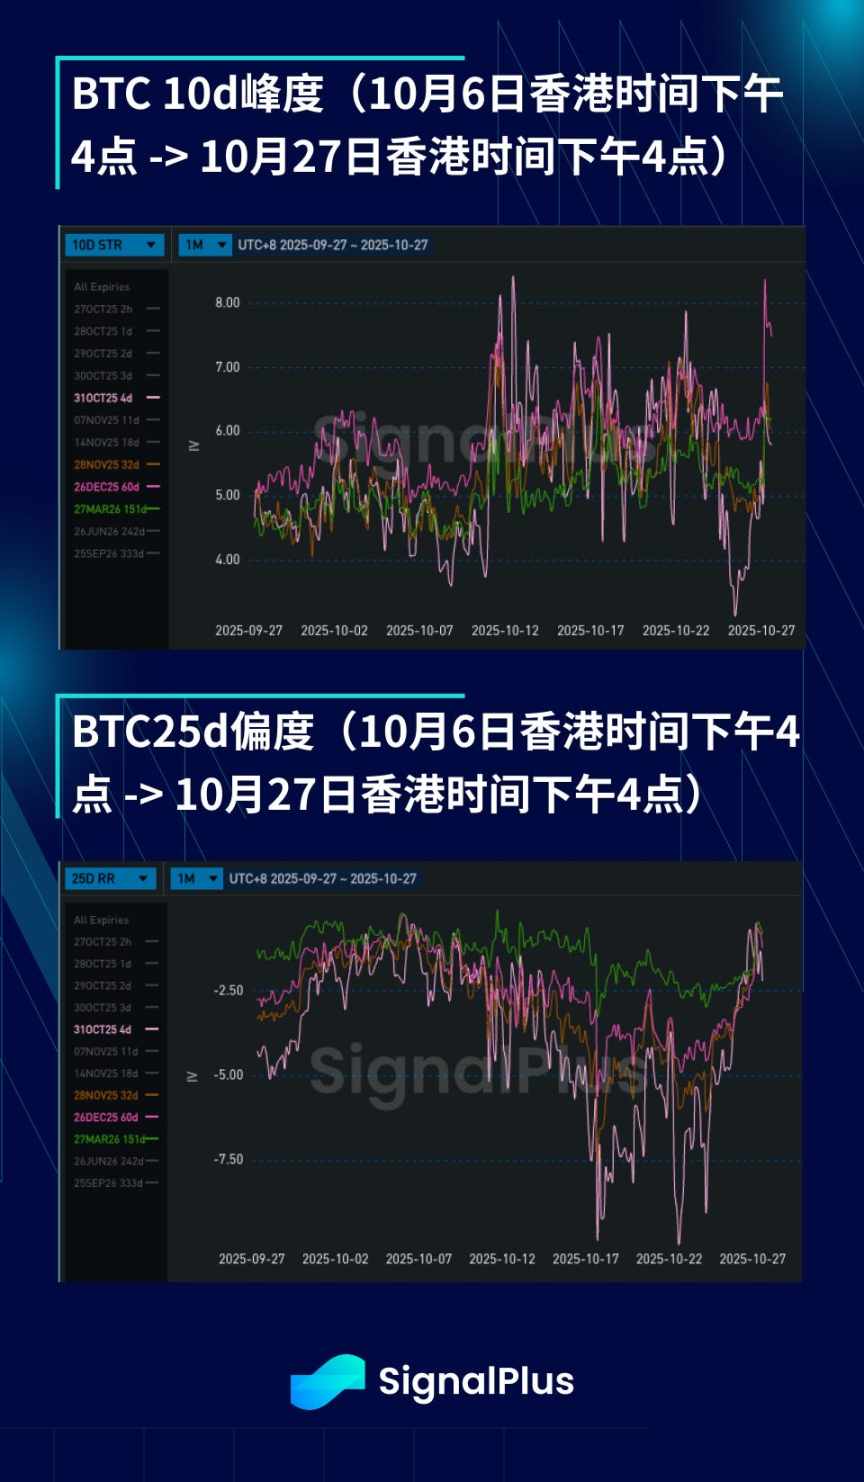
- As concerns over a drop below $100,000 have eased and positive risk sentiment from US-China relations over the weekend has helped spot prices return above $115,000, skew has retreated from deep out-of-the-money put pricing levels. That said, the pricing and actual performance of skew have been very consistent: when spot prices are lower, both implied and realized volatility are much higher, and as prices gradually recover, both begin to stagnate. Therefore, the skew structure favoring puts should remain unchanged, though there may be short-term dislocations around this “fair level.”
- Kurtosis has risen for longer-dated tenors as the market is finally pricing in “volatility of volatility” (we have just witnessed realized volatility jump sharply from the 25–30% range to 50%). In addition, there has been demand for upside wings (calls) in the market, hoping for a significant breakout from current levels, while downside wings (puts) continue to be supported due to the clear stress shown during previous price drops.
Wishing you successful trading in the coming week!

0
0
Disclaimer: The content of this article solely reflects the author's opinion and does not represent the platform in any capacity. This article is not intended to serve as a reference for making investment decisions.
PoolX: Earn new token airdrops
Lock your assets and earn 10%+ APR
Lock now!
You may also like
DOGE Whales Dump 500M Coins in Major Weekly Sell-Off
Cryptonewsland•2025/10/29 05:51

The Big Reversal Is Loading — 5 Altcoins Showing 10x Potential as Bullish Momentum Builds
Cryptonewsland•2025/10/29 05:51

All Eyes on CPI — 5 Altcoins Ready to Explode 100x If Risk Appetite
Cryptonewsland•2025/10/29 05:51

Analyst Predicts the Next Big Move for SHIB After a Long Dormant Phase
Cryptonewsland•2025/10/29 05:51

Trending news
MoreCrypto prices
MoreBitcoin
BTC
$113,198.07
-0.44%
Ethereum
ETH
$4,034.57
-1.08%
Tether USDt
USDT
$1
+0.01%
XRP
XRP
$2.62
+0.06%
BNB
BNB
$1,110.61
-1.36%
Solana
SOL
$195.53
-1.86%
USDC
USDC
$0.9998
-0.02%
Dogecoin
DOGE
$0.1942
-2.25%
TRON
TRX
$0.2972
+0.40%
Cardano
ADA
$0.6457
-2.03%
How to buy BTC
Bitget lists BTC – Buy or sell BTC quickly on Bitget!
Trade now
Become a trader now?A welcome pack worth 6200 USDT for new users!
Sign up now