Dogecoin is trading near $0.203 and continues to move inside a rising channel that has been developing since April. The structure printed a clear bullish flag on the daily chart after a strong impulse in mid-May. This consolidation pattern is now tightening, while the RSI hovers around 46 and the price remains below the 50-day EMA at $0.219.
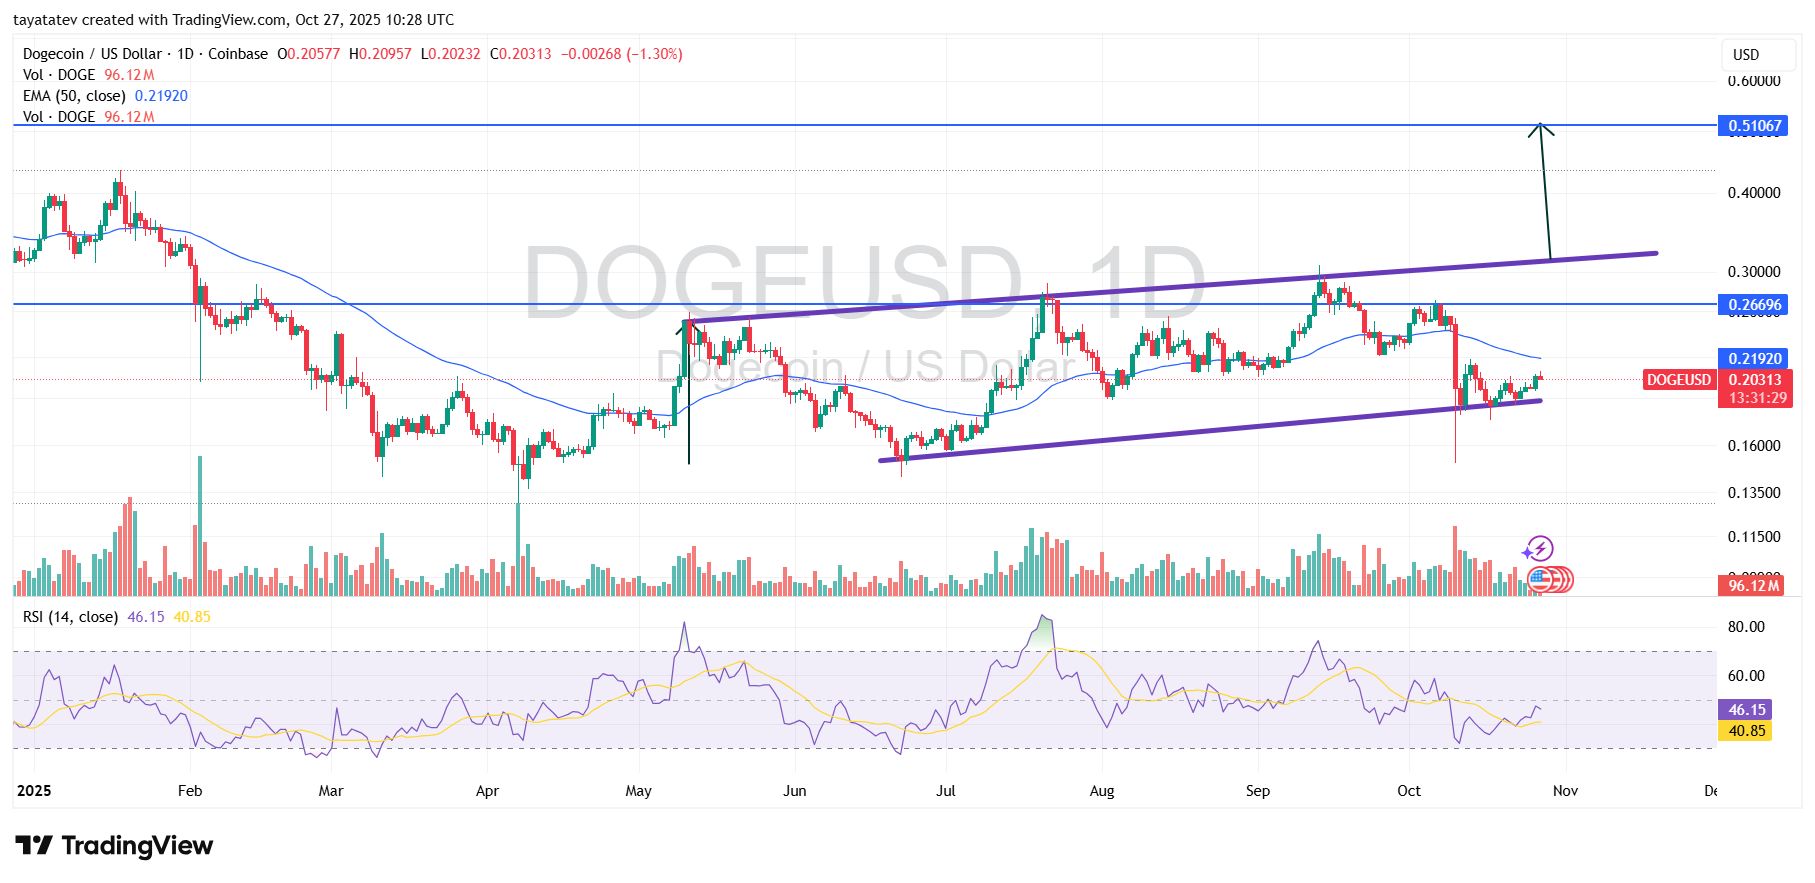 Dogecoin Bullish Flag Breakout Setup. Source : TradingView
The bullish flag’s resistance aligns with the mid-channel zone and the horizontal barrier at $0.2669, which is the first level Dogecoin must reclaim to confirm momentum continuation. As long as price stays inside the channel and holds higher lows, buyers keep technical control of the structure.
If Dogecoin breaks above $0.2669 and closes above the flag resistance with volume, the pattern would confirm. Based on the pole-to-flag measured move, the breakout projects a 152% rally from current levels, placing a technical target near $0.51. This aligns with the higher resistance marked on the chart.
However, until the breakout occurs, DOGE remains in consolidation. The channel support near $0.17–$0.18 continues to act as the defensive zone, while the 50-day EMA serves as immediate pressure. A rejection at the $0.2669 line would keep price inside the flag and delay the upside scenario.
Dogecoin now approaches a decisive phase. A daily close above $0.2669 would open the path toward $0.30 first, and then toward the $0.51 measured target if momentum accelerates. Until then, traders watch volume and channel support to confirm conviction on the next direction.
Dogecoin MACD shifts bullish, but zero-line reclaim still pending
Oct. 27, 2025 — On the daily chart, DOGE’s MACD just flipped constructive. The MACD line has crossed above the signal line below zero, and the histogram turned green. This is a bullish crossover that signals improving momentum, yet it remains an early-stage signal because both lines sit under the zero line.
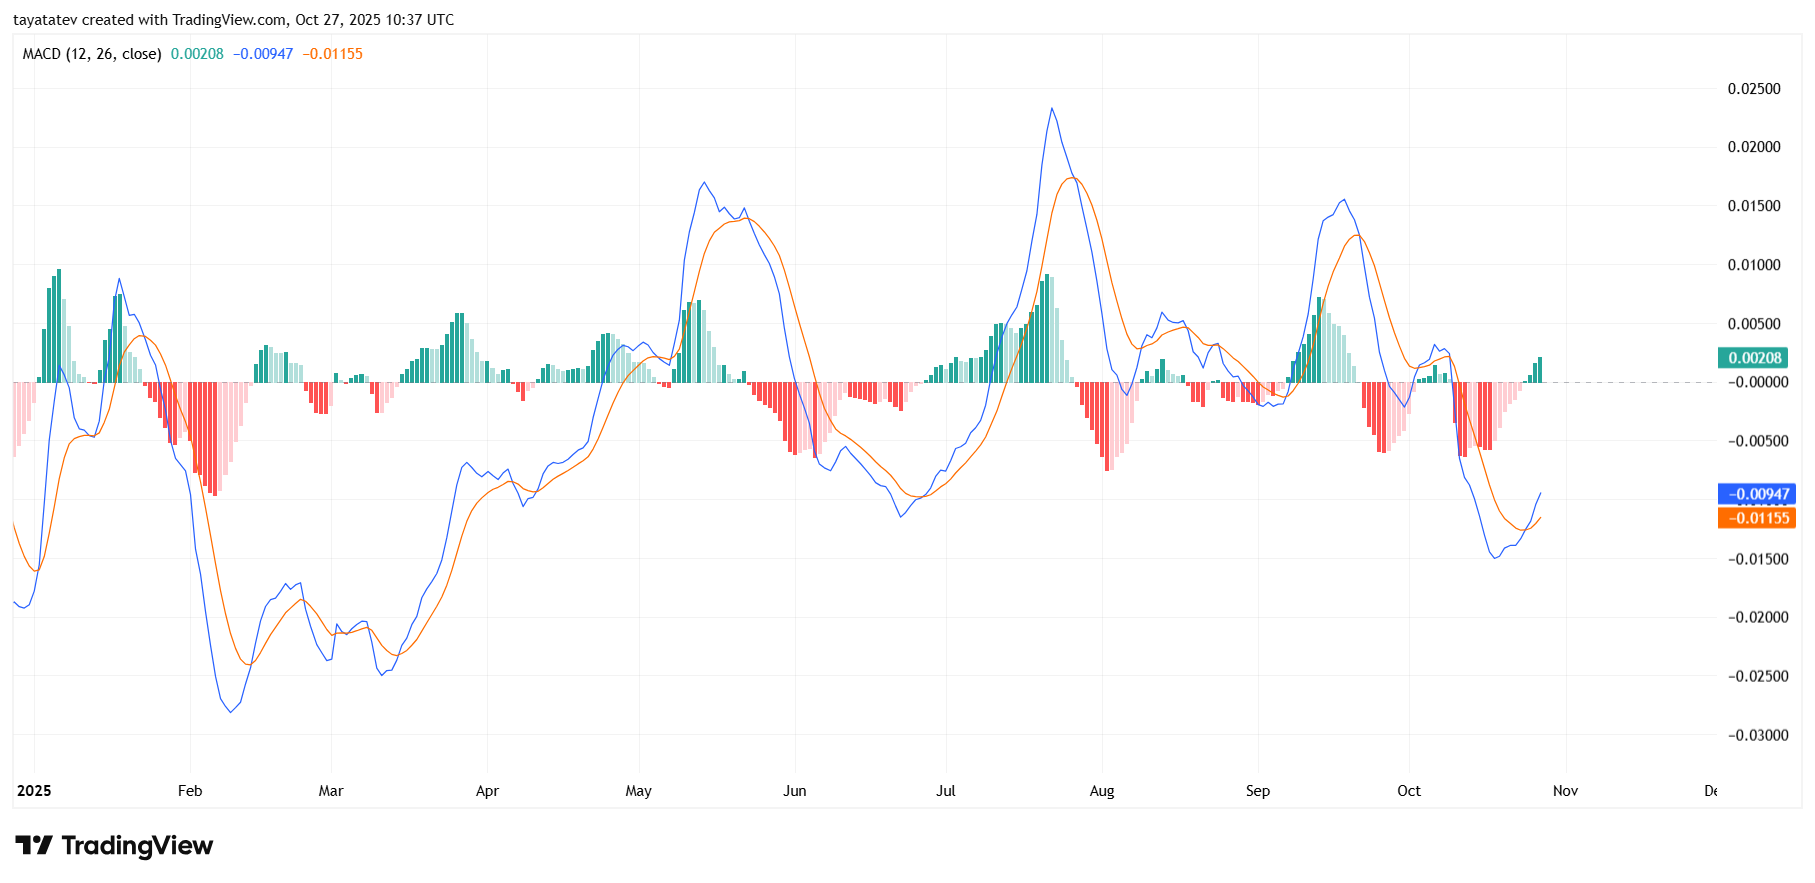 Dogecoin Daily MACD Bullish Crossover. Source: TradingView
Moreover, momentum carved a higher low on the MACD in mid-October versus the early-October trough, while price held the rising channel. That mild bullish divergence supports the recovery narrative.
From here, watch two confirmations. First, a zero-line break on the MACD would mark a regime shift to positive momentum. Second, price should push through the nearby structure levels discussed on the price chart: reclaim the 50-day EMA (~$0.219) and then clear $0.2669 to unlock further upside. Failing that, a roll-under (MACD dropping back below the signal with a red histogram) would signal momentum fading and keep DOGE in consolidation.

Editor at Kriptoworld
LinkedIn | X (Twitter)
Tatevik Avetisyan is an editor at Kriptoworld who covers emerging crypto trends, blockchain innovation, and altcoin developments. She is passionate about breaking down complex stories for a global audience and making digital finance more accessible.
📅 Published: October 27, 2025 • 🕓 Last updated: October 27, 2025