
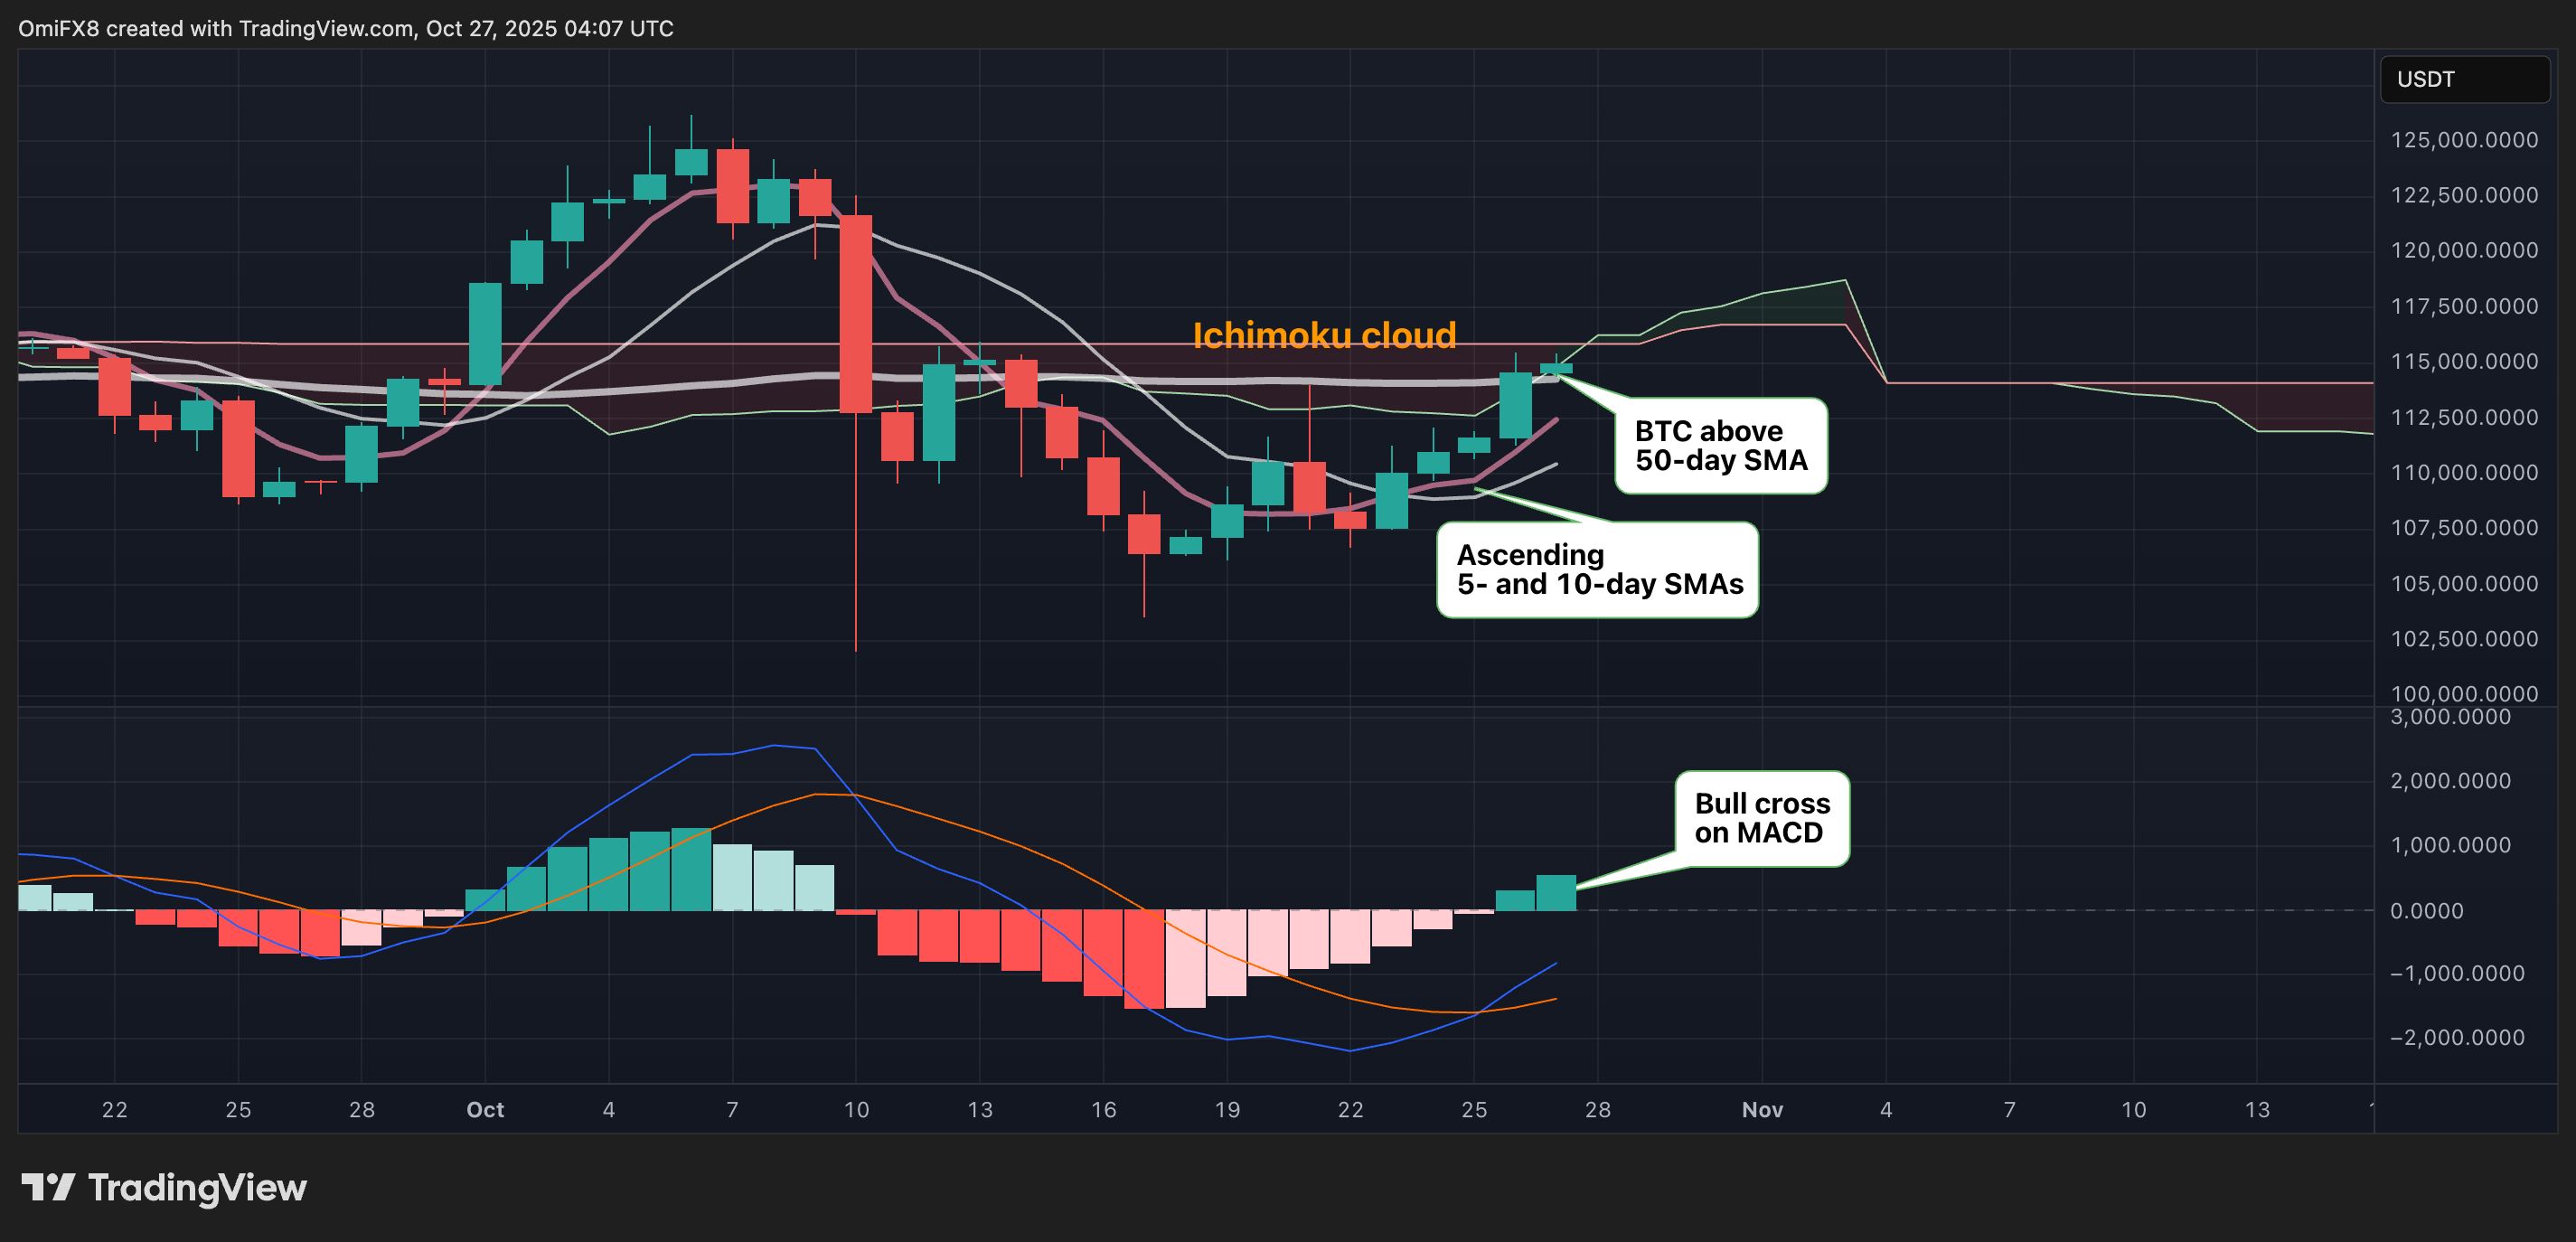
Bitcoin Surpasses 50-Day Average, but CoinDesk BTC Trend Indicator Remains Bearish

Bitcoin BTC$115,222.04 has recently crossed above the 50-day simple moving average (SMA), a widely observed indicator of a short-term bullish trend. This breakout is validated by technical indicators including a fresh bullish crossover on the daily MACD histogram and a bullish cross between the 5- and 10-day SMAs, signaling growing upward momentum.
The recent upswing in BTC price is likely fueled by market expectations of a Federal Reserve rate cut anticipated this Wednesday and positive developments in the ongoing U.S.-China trade tensions.
Despite these encouraging signs, caution is warranted as the CoinDesk Bitcoin Trend Indicator (BTI), which gauges the presence, direction, and strength of momentum, continues to signal downtrend. Further, BTC prices remain below the Ichimoku cloud on the daily chart, a key resistance level. A decisive move above this cloud would confirm the bullish revival and potentially set the stage for a rally toward $120,000 and beyond.
Disclaimer: The content of this article solely reflects the author's opinion and does not represent the platform in any capacity. This article is not intended to serve as a reference for making investment decisions.
You may also like
XRP’s Dip Volume Drama and Solana’s EMA Struggle: Shakeout or Sneaky Rebound?

2025: The Most Bizarre Crypto Cycle in History—Manipulation, Collapse, and the Rebirth of a New Order

4E: Declining Bitcoin illiquidity supply may suppress price rebound
Pieverse to launch x402b protocol, supporting BNB Chain gas-free payments and compliant receipts