

Date: Mon, Oct 27, 2025 | 03:50 AM GMT
The broader cryptocurrency market is showing strong upside performance with both Bitcoin (BTC) and Ethereum (ETH) trading in green, posting 24-hour jumps of 3% and 7%, respectively. This bullish momentum is creating potential upside in several major altcoins — including Xai (XAI).
XAI is trading in the green today with a 4% gain, and more importantly, its chart is now displaying a key pattern formation that hints at a potential breakout in the sessions ahead.
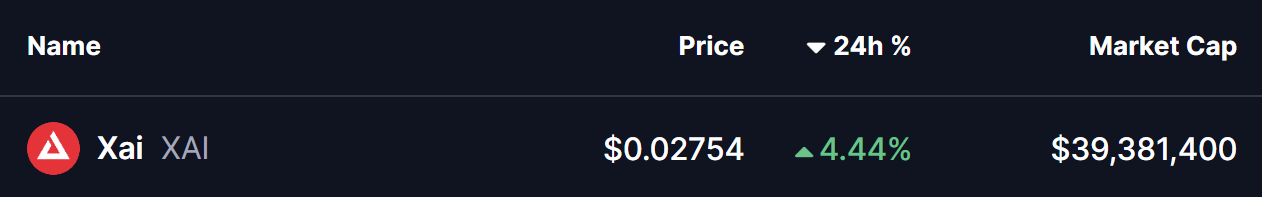 Source: Coinmarketcap
Descending Broadening Wedge Pattern in Play
On the daily chart, XAI has been moving within a descending broadening wedge — a bullish technical pattern that typically forms during a downtrend and signals a potential reversal once price breaks upward.
After the steep drop in early October, when XAI briefly crashed near $0.010, the token has since rebounded, gradually recovering to around $0.0275. The price now sits near the upper boundary of the wedge, showing signs of compression — a condition often seen before strong breakout moves.
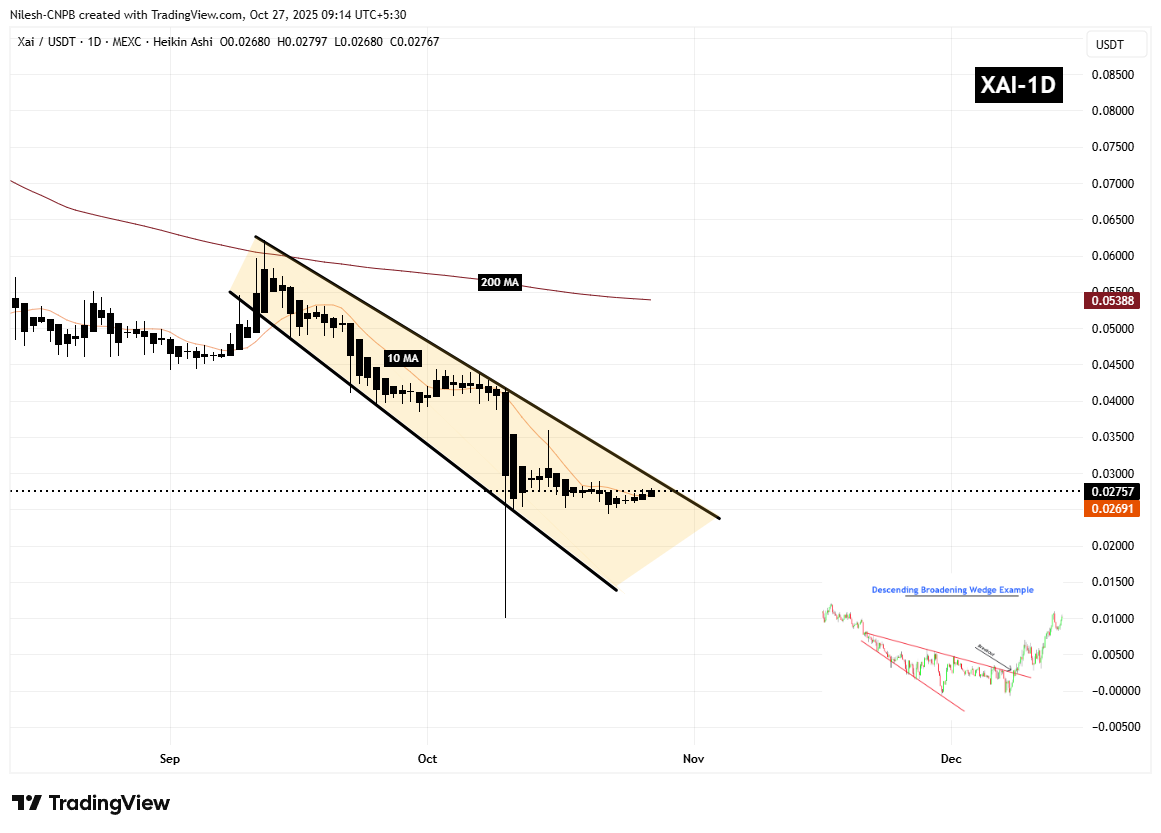 Xai (XAI) Daily Chart/Coinsprobe (Source: Tradingview)
Additionally, XAI has reclaimed its 10-day moving average (MA) at $0.02691, reinforcing short-term support. As long as the price holds above this level, bulls may gain enough strength to push through the descending resistance line.
What’s Next for XAI?
If buyers manage to maintain momentum and break above the wedge pattern, XAI could witness a quick rally toward its 200-day MA, currently around $0.05388 — a potential 95% upside from current prices.
However, in case of rejection at the upper wedge boundary, $0.02437 remains the key support zone to watch. A drop below this level could delay any bullish breakout and keep XAI in a consolidation range.
For now, the technical setup looks promising — and if broader market strength continues, Xai (XAI) could soon be among the altcoins leading the next leg of the rally.