Date: Sat, Oct 25, 2025 | 06:00 AM GMT
The broader cryptocurrency market is showing a mixed performance today, with Bitcoin (BTC) trading in green while Ethereum (ETH) is down by 1.20% at reporting — yet several altcoins , including XRP, continue to show promising signs of upside potential.
XRP is up 4% today, extending its weekly gain to nearly 9%, and more importantly, its latest chart formation is displaying a harmonic structure that could set the stage for further bullish momentum in the days ahead.
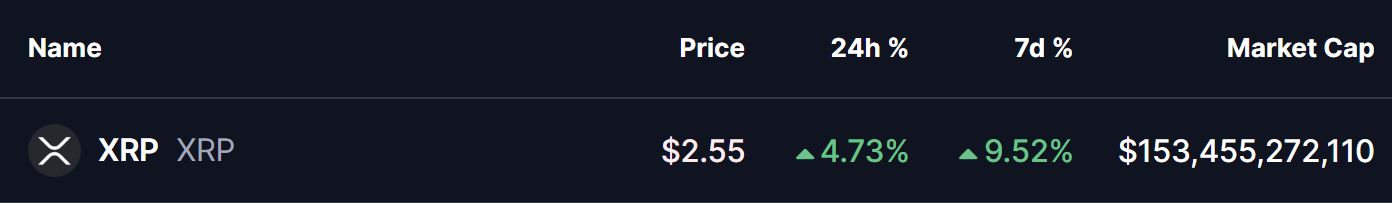 Source: Coinmarketcap
Harmonic Pattern Hints at Potential Upside
On the 4-hour chart, XRP has formed a Bearish Butterfly harmonic pattern. Despite its name, this setup often features a bullish rally during the CD leg before price action reaches the Potential Reversal Zone (PRZ).
The pattern began at Point X ($2.6479), dropped to Point A, rallied to Point B, and retraced to Point C near $2.3209. From there, XRP has regained strength and is now trading around $2.55, successfully reclaiming its 100-hour moving average (MA) — a signal that buyers are regaining control and momentum is building up again.
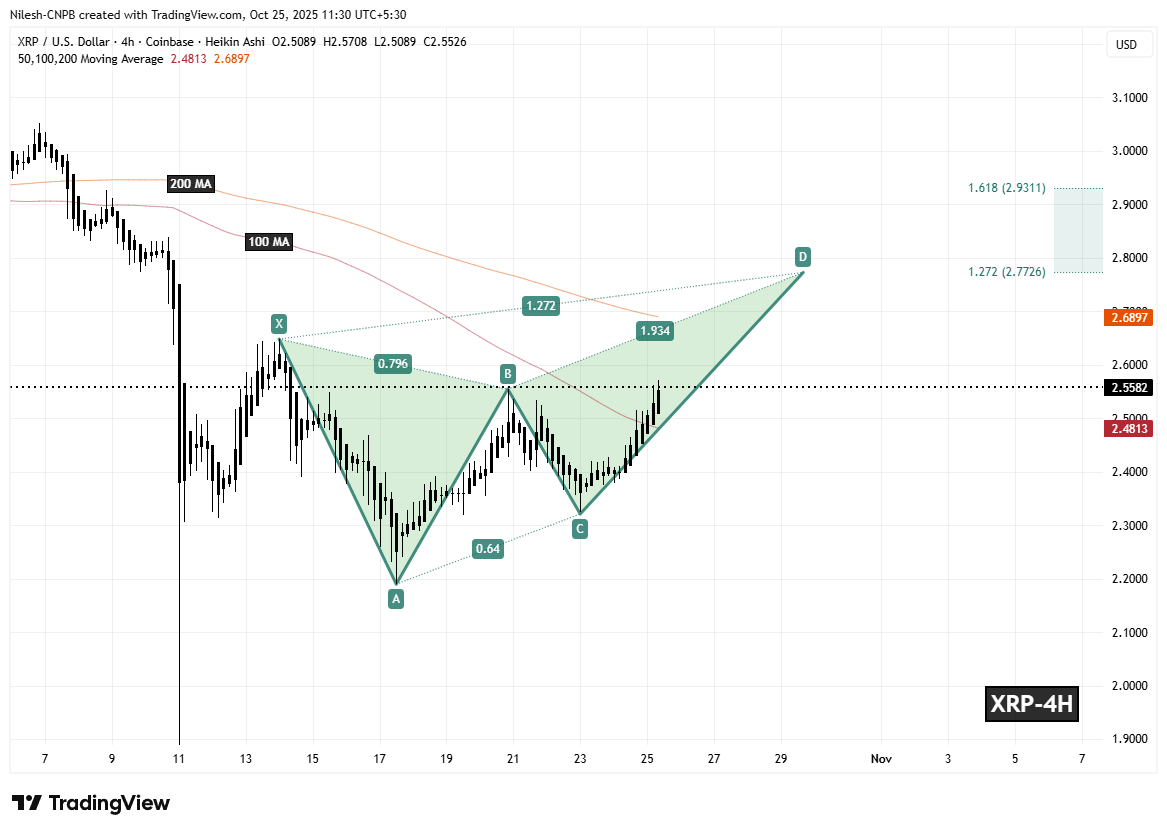 XRP 4H Chart/Coinsprobe (Source: Tradingview)
The next immediate test lies at the 50-hour MA near $2.6897. A decisive breakout and close above this level would likely confirm a continuation of the bullish CD leg toward the PRZ.
What’s Next for XRP?
If bulls manage to defend the 100-hour MA and push XRP above the 50-hour MA, the pattern projects an upside move toward the PRZ zone between $2.7726 (1.272 Fibonacci extension) and $2.9311 (1.618 extension). Historically, these levels tend to mark the completion of the Butterfly pattern — making them key targets for traders eyeing short-term gains.
On the downside, if XRP loses its 100-hour MA support, the bullish momentum could weaken, opening the door for a short-term consolidation phase before any renewed rally attempt.