Date: Sat, Oct 25, 2025 | 08:30 AM GMT
The broader cryptocurrency market is showing steady performance today, with Bitcoin (BTC) and Ethereum (ETH) trading flat. Despite the muted price action in majors, several altcoins — including Stellar (XLM) — are displaying promising technical setups that hint at possible upside momentum in the near term.
XLM is in green today with modest gains but more importantly, its chart is now displaying a key pattern formation that hints at a potential breakout in the sessions ahead.
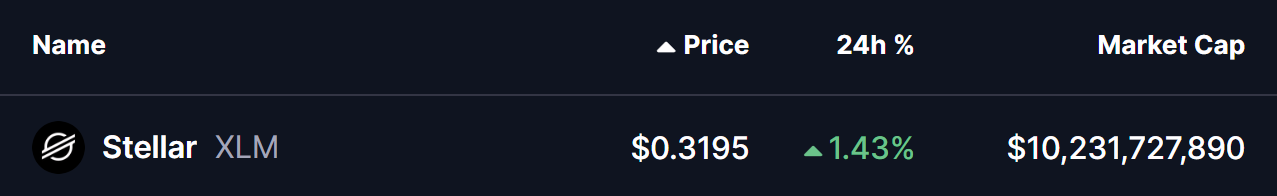 Source: Coinmarketcap
Symmetrical Triangle in Play
On the 4-hour chart, XLM is consolidating within a Symmetrical Triangle pattern — a structure that represents a tug of war between buyers and sellers before a decisive breakout. Historically, such formations tend to resolve in the direction of the prevailing trend, which, in XLM’s case, has recently leaned bullish.
The chart shows that XLM recently rebounded from the support base near $0.3024, where buyers stepped in following a short-term dip. This bounce helped the token reclaim its 50-hour moving average (MA) around $0.3156, with the current price hovering near $0.3195, just under the upper boundary of the triangle.
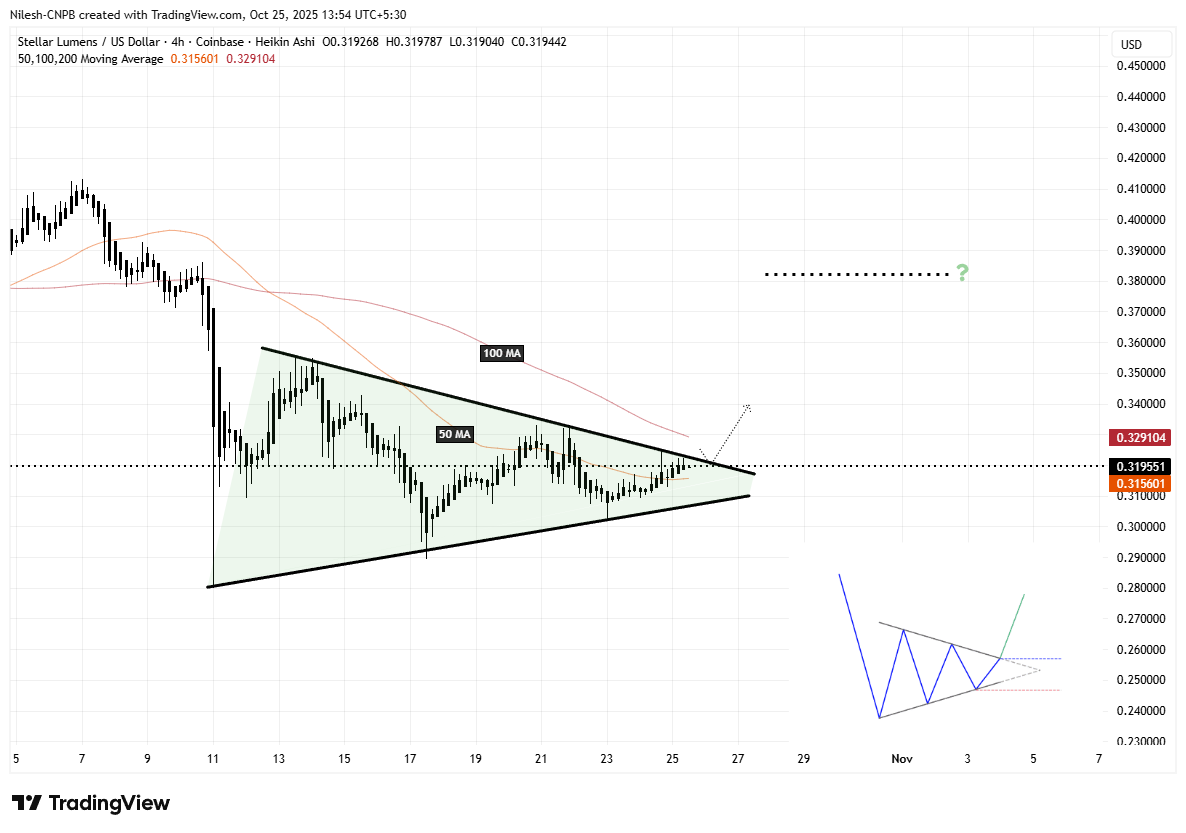 Stellar (XLM) 4H Chart/Coinsprobe (Source: Tradingview)
This technical alignment suggests that a breakout attempt may be imminent.
What’s Next for XLM?
If bulls manage to defend the 50-hour MA and achieve a breakout above the triangle’s upper trendline, ideally followed by a reclaim of the 100-hour MA ($0.3291), it could open the door for an extended upside move. Based on the measured move projection, XLM could potentially rally toward $0.3823, marking a possible 19% upside from current levels.
On the flip side, if XLM fails to gain momentum and breaks below the triangle’s lower support line, the bullish scenario could be postponed, with traders likely watching the $0.302 region for the next bounce attempt.