Pro Trader Gives Bitcoin Warning Based On 1970s Soybean Crash

Veteran trader Peter Brandt warns Bitcoin is forming a bearish "broadening top" pattern, suggesting a potential crash to $60,000. Another analyst quickly countered, predicting a bullish breakout instead.
A debate is heating up among top market analysts. This follows veteran cryptocurrency trader Peter Brandt’s suggestion that Bitcoin’s recent price action is dangerously mirroring a pattern observed in the 1970s soybean market.
This pattern indicates the current cycle may have already reached its peak.
The Rare ‘Broadening Top’ Formation
Peter Brandt is a veteran trader and chart analyst who has been active in the futures and forex markets since 1975. He has gained notoriety over decades for accurate trend predictions and trades across commodities, futures, and crypto markets.
Brandt became particularly famous for his pattern analysis, which precisely predicted the Bitcoin price action in 2017–2018.
In a recent X post, Brandt pointed out that Bitcoin is currently forming a rare “broadening top” pattern on its charts. This technical analysis formation is characterized by two trend lines that increasingly diverge.
This action creates a megaphone shape as the price swings within a wider range.
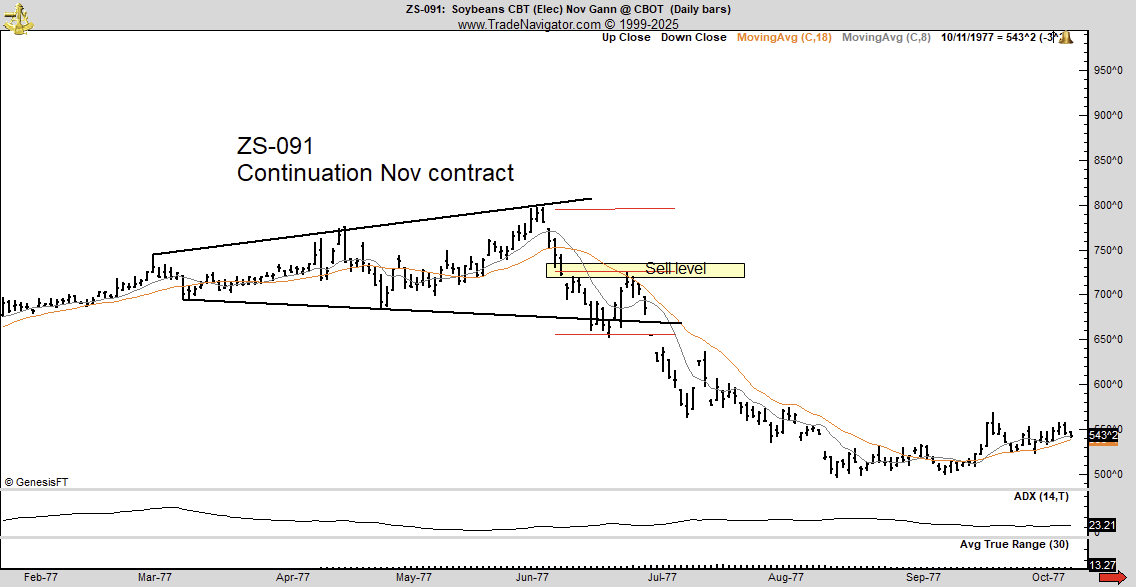 1970s Soybeans CBT Chart. Source: PeterLBrandt
This pattern is typically recognized as a reversal signal appearing at the climax of an upward trend. The completion of the pattern often results in a sharp breakdown below the lower trend line, signaling the start of a major bearish reversal.
Historical Parallel to Soybeans and MSTR Risk
Brandt drew a direct historical comparison to justify his caution: “In 1977 Soybeans formed a broadening top and then declined 50% in value. Bitcoin today is forming a similar pattern.”
He highlighted a significant market risk: “A 50% decline in $BTC will put $MSTR underwater.” The possibility of a collapse in MicroStrategy (MSTR) triggering a downward spiral in Bitcoin is a known, though unusual, scenario. This is given MSTR’s massive BTC holdings.
Contrary to market expectations, Brandt concluded that a massive bull run may not materialize this cycle. Instead, he suggested that Bitcoin could correct down to $60,000.
Counterpoint: Is It a Bullish ‘Wedge’?
Brandt’s bearish thesis did not go unchallenged. Prominent chart analyst immediately rebutted Brandt’s post.
The analyst agreed that both the 1970s soybean chart and the 2025 Bitcoin chart display a broadening structure, which is characterized by increasingly higher highs and lower lows. However, he argued that the underlying trend differentiates their meaning.
He contended that the soybean chart was an Ascending Megaphone pattern formed during an uptrend. In contrast, Bitcoin’s price is currently situated within a Descending Broadening Wedge.
This wedge, he noted, is a structure where downside selling pressure weakens as energy accumulates, ultimately foreshadowing a bullish breakout.
Disclaimer: The content of this article solely reflects the author's opinion and does not represent the platform in any capacity. This article is not intended to serve as a reference for making investment decisions.
You may also like
Uniswap Foundation provides up to $9 million in funding to Brevis for building a trustless Routing Rebate program
The Uniswap Foundation has granted funding to Brevis to develop and implement a "Trustless Routing Rebate Program," offering up to $9 million in gas fee rebates to routers integrating v4 Hook pools. This system will utilize Brevis' ZK Data Coprocessor and Pico zkVM to compute and verify all rebate amounts in a trustless manner, without relying on centralized databases or hidden computation. By providing economic incentives to aggregators, this initiative encourages them to prioritize Hook integration, thereby accelerating the adoption of v4.

Trump Nominates Michael Selig to Lead CFTC Amid Crypto Oversight Push

XRP Price Holds at $2.58 as Traders Monitor Critical $2.60 Resistance Zone