- Pepe is trading at $0.00001124 and has fallen by 6.9% and it is supported by $0.00001117.
- The resistance at $0.00001215 is still obstructing recovery efforts even after multiple tests.
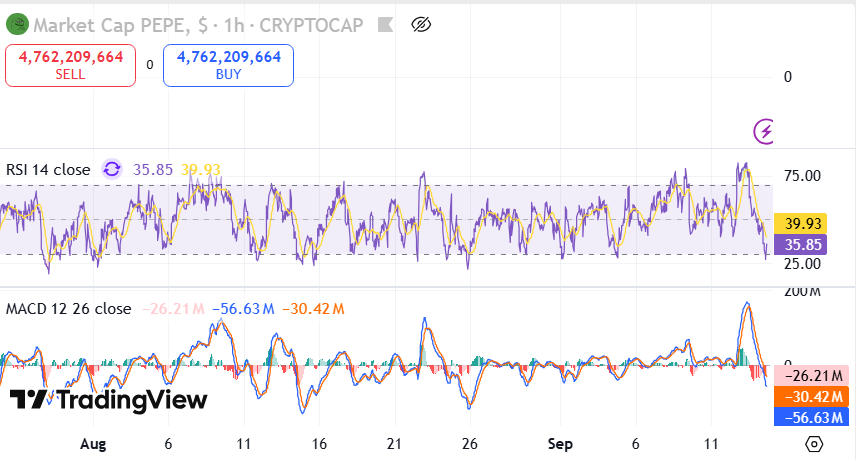
- The selling pressure dominates the market, which is supported by the RSI of about 39.73 and the negative MACD values.
Pepe ( PEPE) showed a sharp fall in the past 24 hours, dropping by 6.9% to close at $0.00001124. The recent decline came with an unsuccessful effort to support higher resistance levels and made a renewed emphasis on short-term support. The technical information indicates that the token is trading in a low-price range and both the buyers and sellers are trying to dominate the trend. Although the market is volatile, daily and intraday signals point to the significant areas, which may inform the price action in the short term.
Support and Resistance Levels Define Ongoing Trading Pressure
The current support level of $0.00001117 has been tested countless times in the recent downtrend. Rejections from this level have been shown in the price action in the daily chart, which portrays notable interest in maintaining the base. However, the constant pressure from sellers has preserved the token in bearish momentum. The trading statistics also show a daily range headed by $0.00001215 on the higher side, which signifies the significance of the support-resistance balance.
On the positive side, the level of resistance stands at $0.00001215. Previous attempts to break the level have been frustrated, which has seen sharp pullbacks follow. Candlestick patterns on the daily chart reveal various rejections, highlighting how resistance continues to block sustained rallies. The failed flops around this range also highlight the challenges buyers are experiencing. Notably, the inability to move higher has allowed bearish pressure to dominate intraday sessions.
Indicators Reflect Market Strain
Momentum indicators confirm the broader struggle around these zones. The RSI currently holds near 39.73, slipping close to oversold territory at 33.12. This reading shows weakening strength as sellers remain active.
 Source; TradingView
The MACD also signals continued stress, with values sitting at –27.5M, –30.74M, and –58.24M across the tracked averages. These figures suggest that the downside market momentum is positive, and recovery attempts are still constrained. The trading has a close grip with the support and resistance proving to be between $0.00001117 and $0.00001215.
The squashed form emphasizes the constant fight of the buyers who want to maintain the equilibrium and the sellers who are toward the ground pushing the opposite way. Pepe remains trapped between firm support at $0.00001117 and resistance at $0.00001215, with weak momentum indicators confirming sellers’ dominance and limiting any near-term recovery attempts.