PUMP Price Now Eyes Fresh All-Time High but Could Pause for a Quick Break First

PUMP price is less than 7% below its all-time high. Charts show bulls remain in control, but signals hint at a short cooldown before another push higher.
The PUMP price trades near $0.0062 at press time on September 12, up almost 6% in the past 24 hours. Week-on-week gains stand at 42.7%, and the token is less than 7% below its all-time high at $0.0068. The rally looks powerful, but early signs suggest the move may cool before pushing higher.
These signals do not point to a full reversal. Instead, they suggest a short breather — a pause that could prepare the ground for a fresh breakout into new highs.
Signs Of Fatigue, But Bulls Still Hold Control
Since September 8, PUMP’s latest upward leg has been running strong. But momentum indicators show the rally may slow before continuing.
The Money Flow Index (MFI) is a momentum tool that blends both price and trading volume. When MFI climbs, it means strong inflows are supporting the rally. When it drops or flattens, it shows that money is no longer entering the market as quickly, even if the token’s price is still rising.
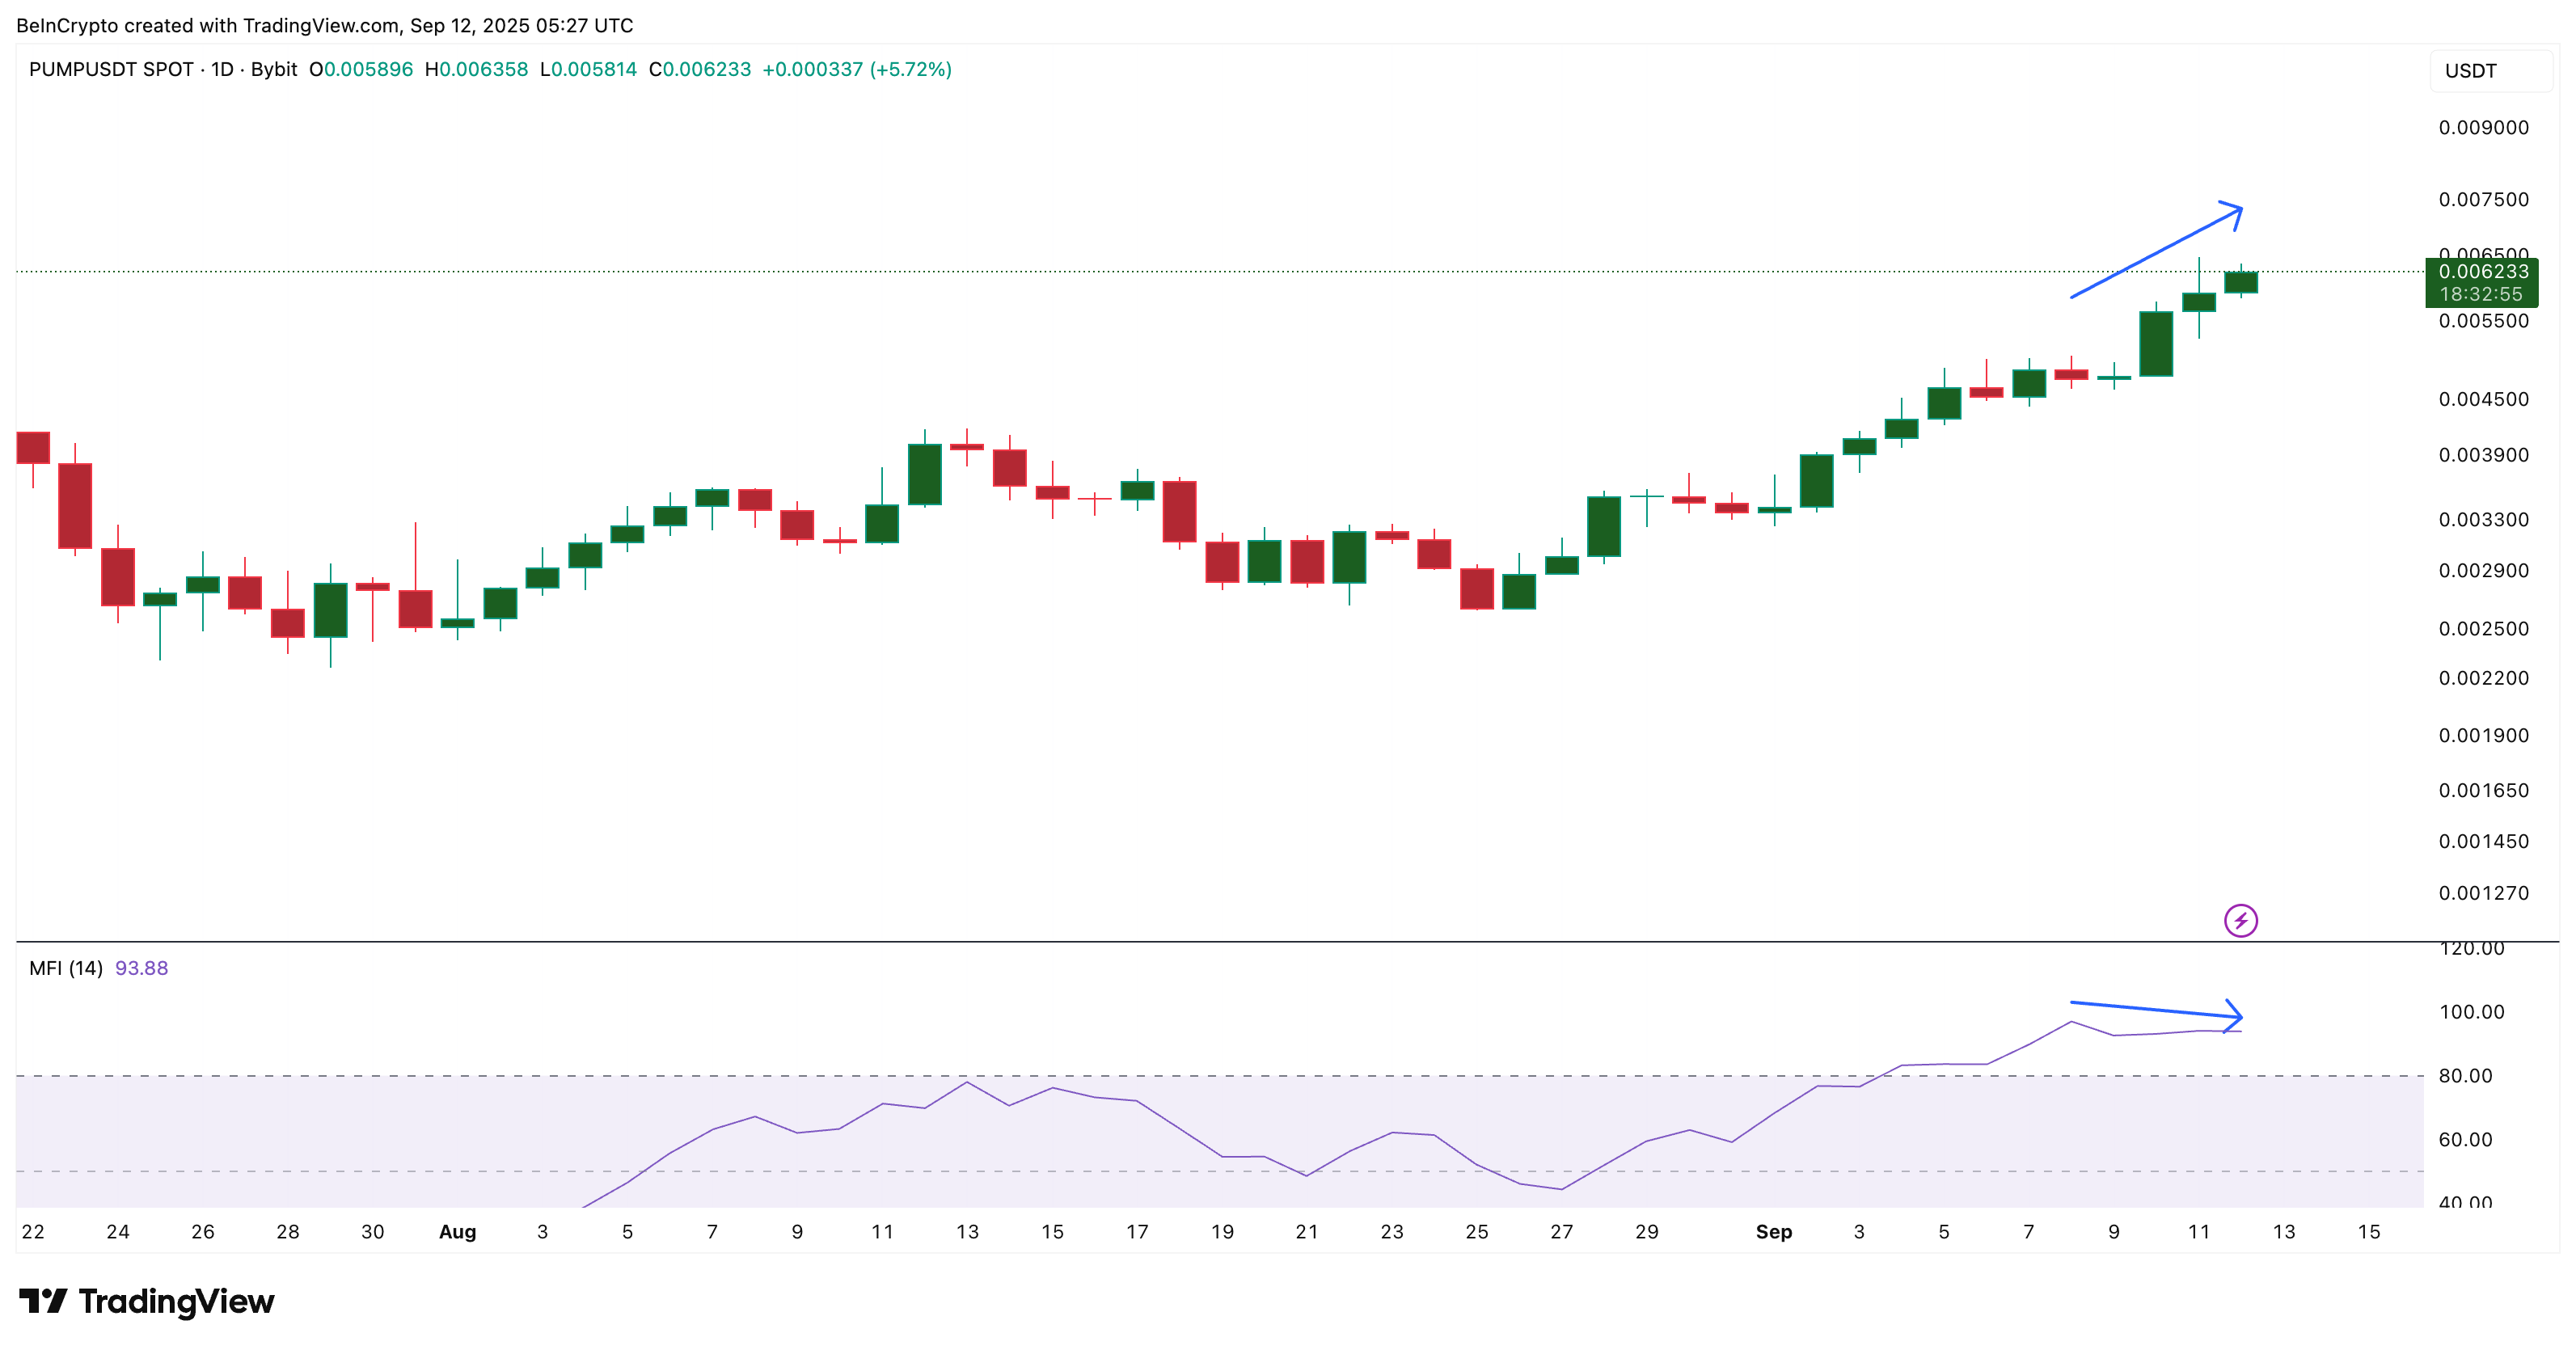 PUMP Price And MFI:
That’s exactly what has happened here. As the PUMP price kept pushing higher as part of its latest leg that started after September 8, MFI trended lower and has now gone flat for the past two daily sessions.
This divergence often signals that new buyers are waiting for better entry levels instead of chasing higher prices. The result is usually a pause or small pullback rather than a collapse.
Want more token insights like this? Sign up for Editor Harsh Notariya’s Daily Crypto Newsletter .
Despite the slowdown in momentum, the Bull-Bear Power indicator — which compares buyer and seller strength — remains tilted in favor of buyers, with green pillars still dominating the chart.
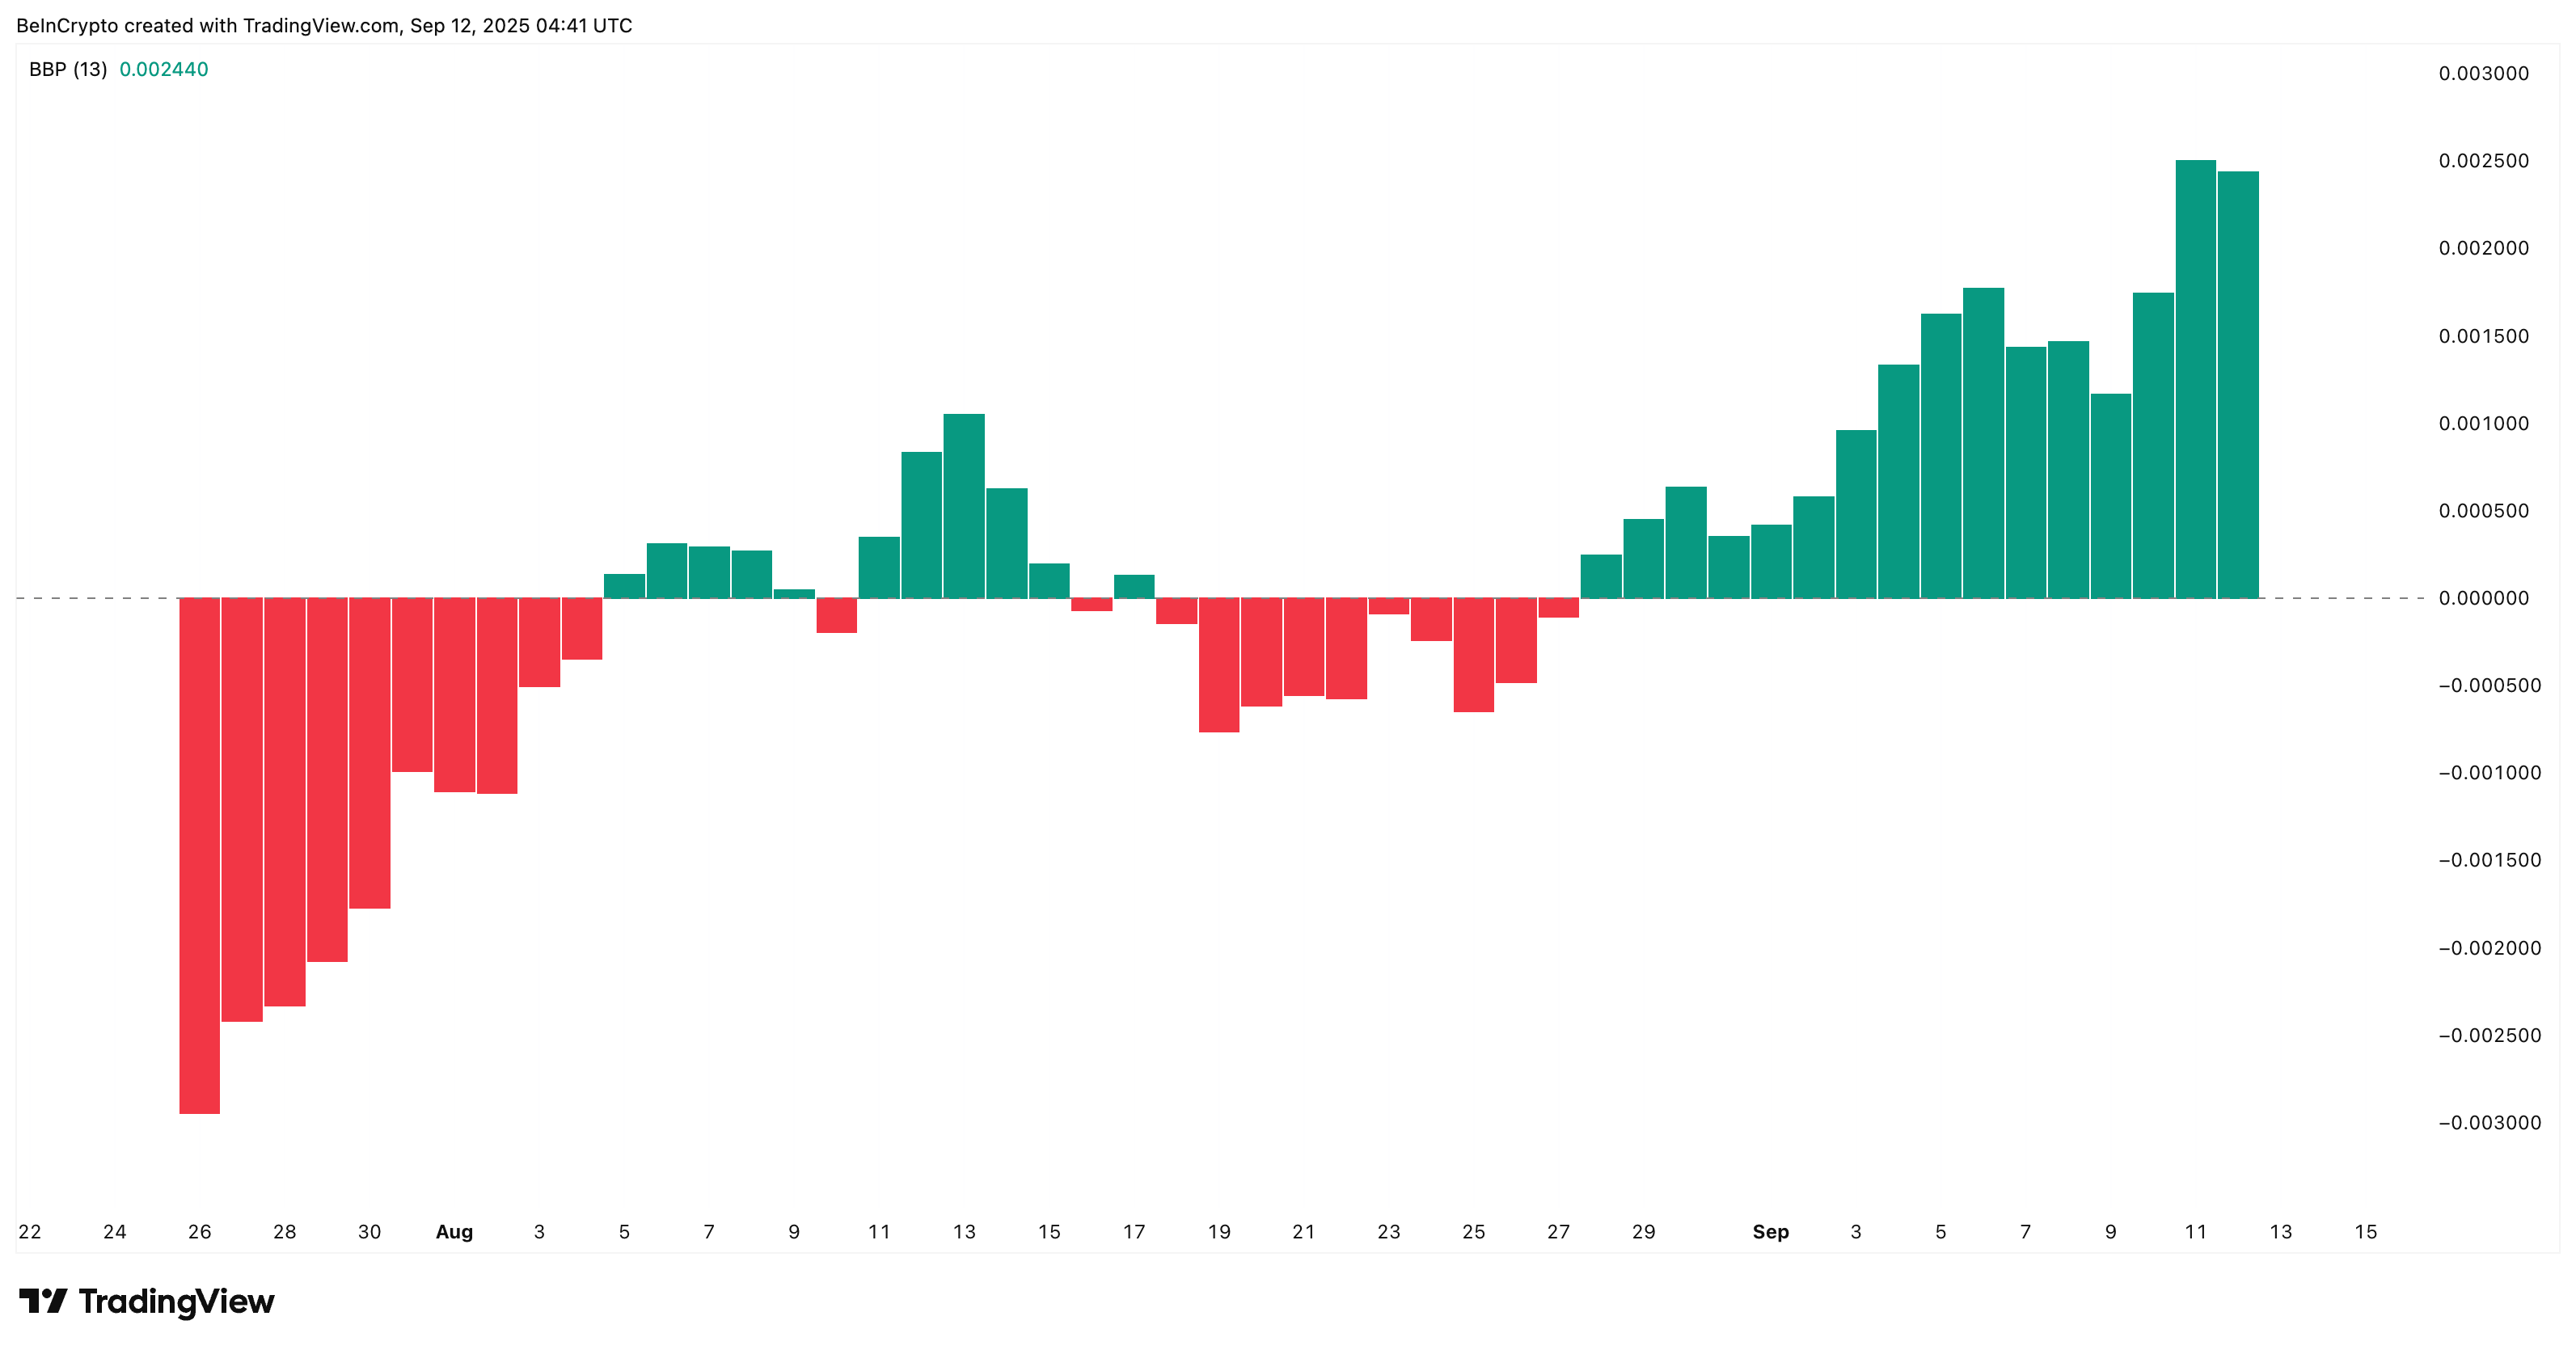 Bulls Still Control PUMP:
The size of these pillars shows buyers are holding control in a significant way. This means bulls continue to drive the market structure, even as momentum indicators like the MFI suggest the rally may pause briefly.
PUMP Price Breakout Setup Intact, But One Metric Suggests A Pause First
The broader price structure supports the broader bullish outlook. On the 4-hour chart, Pump.fun (PUMP) trades inside an ascending channel, a bullish formation that usually breaks upward. The setup shows room for another leg higher, but short-term signals suggest the move could take a breather first.
The Relative Strength Index (RSI) helps explain why. RSI measures the speed and size of recent price changes to show whether an asset is overbought or oversold.
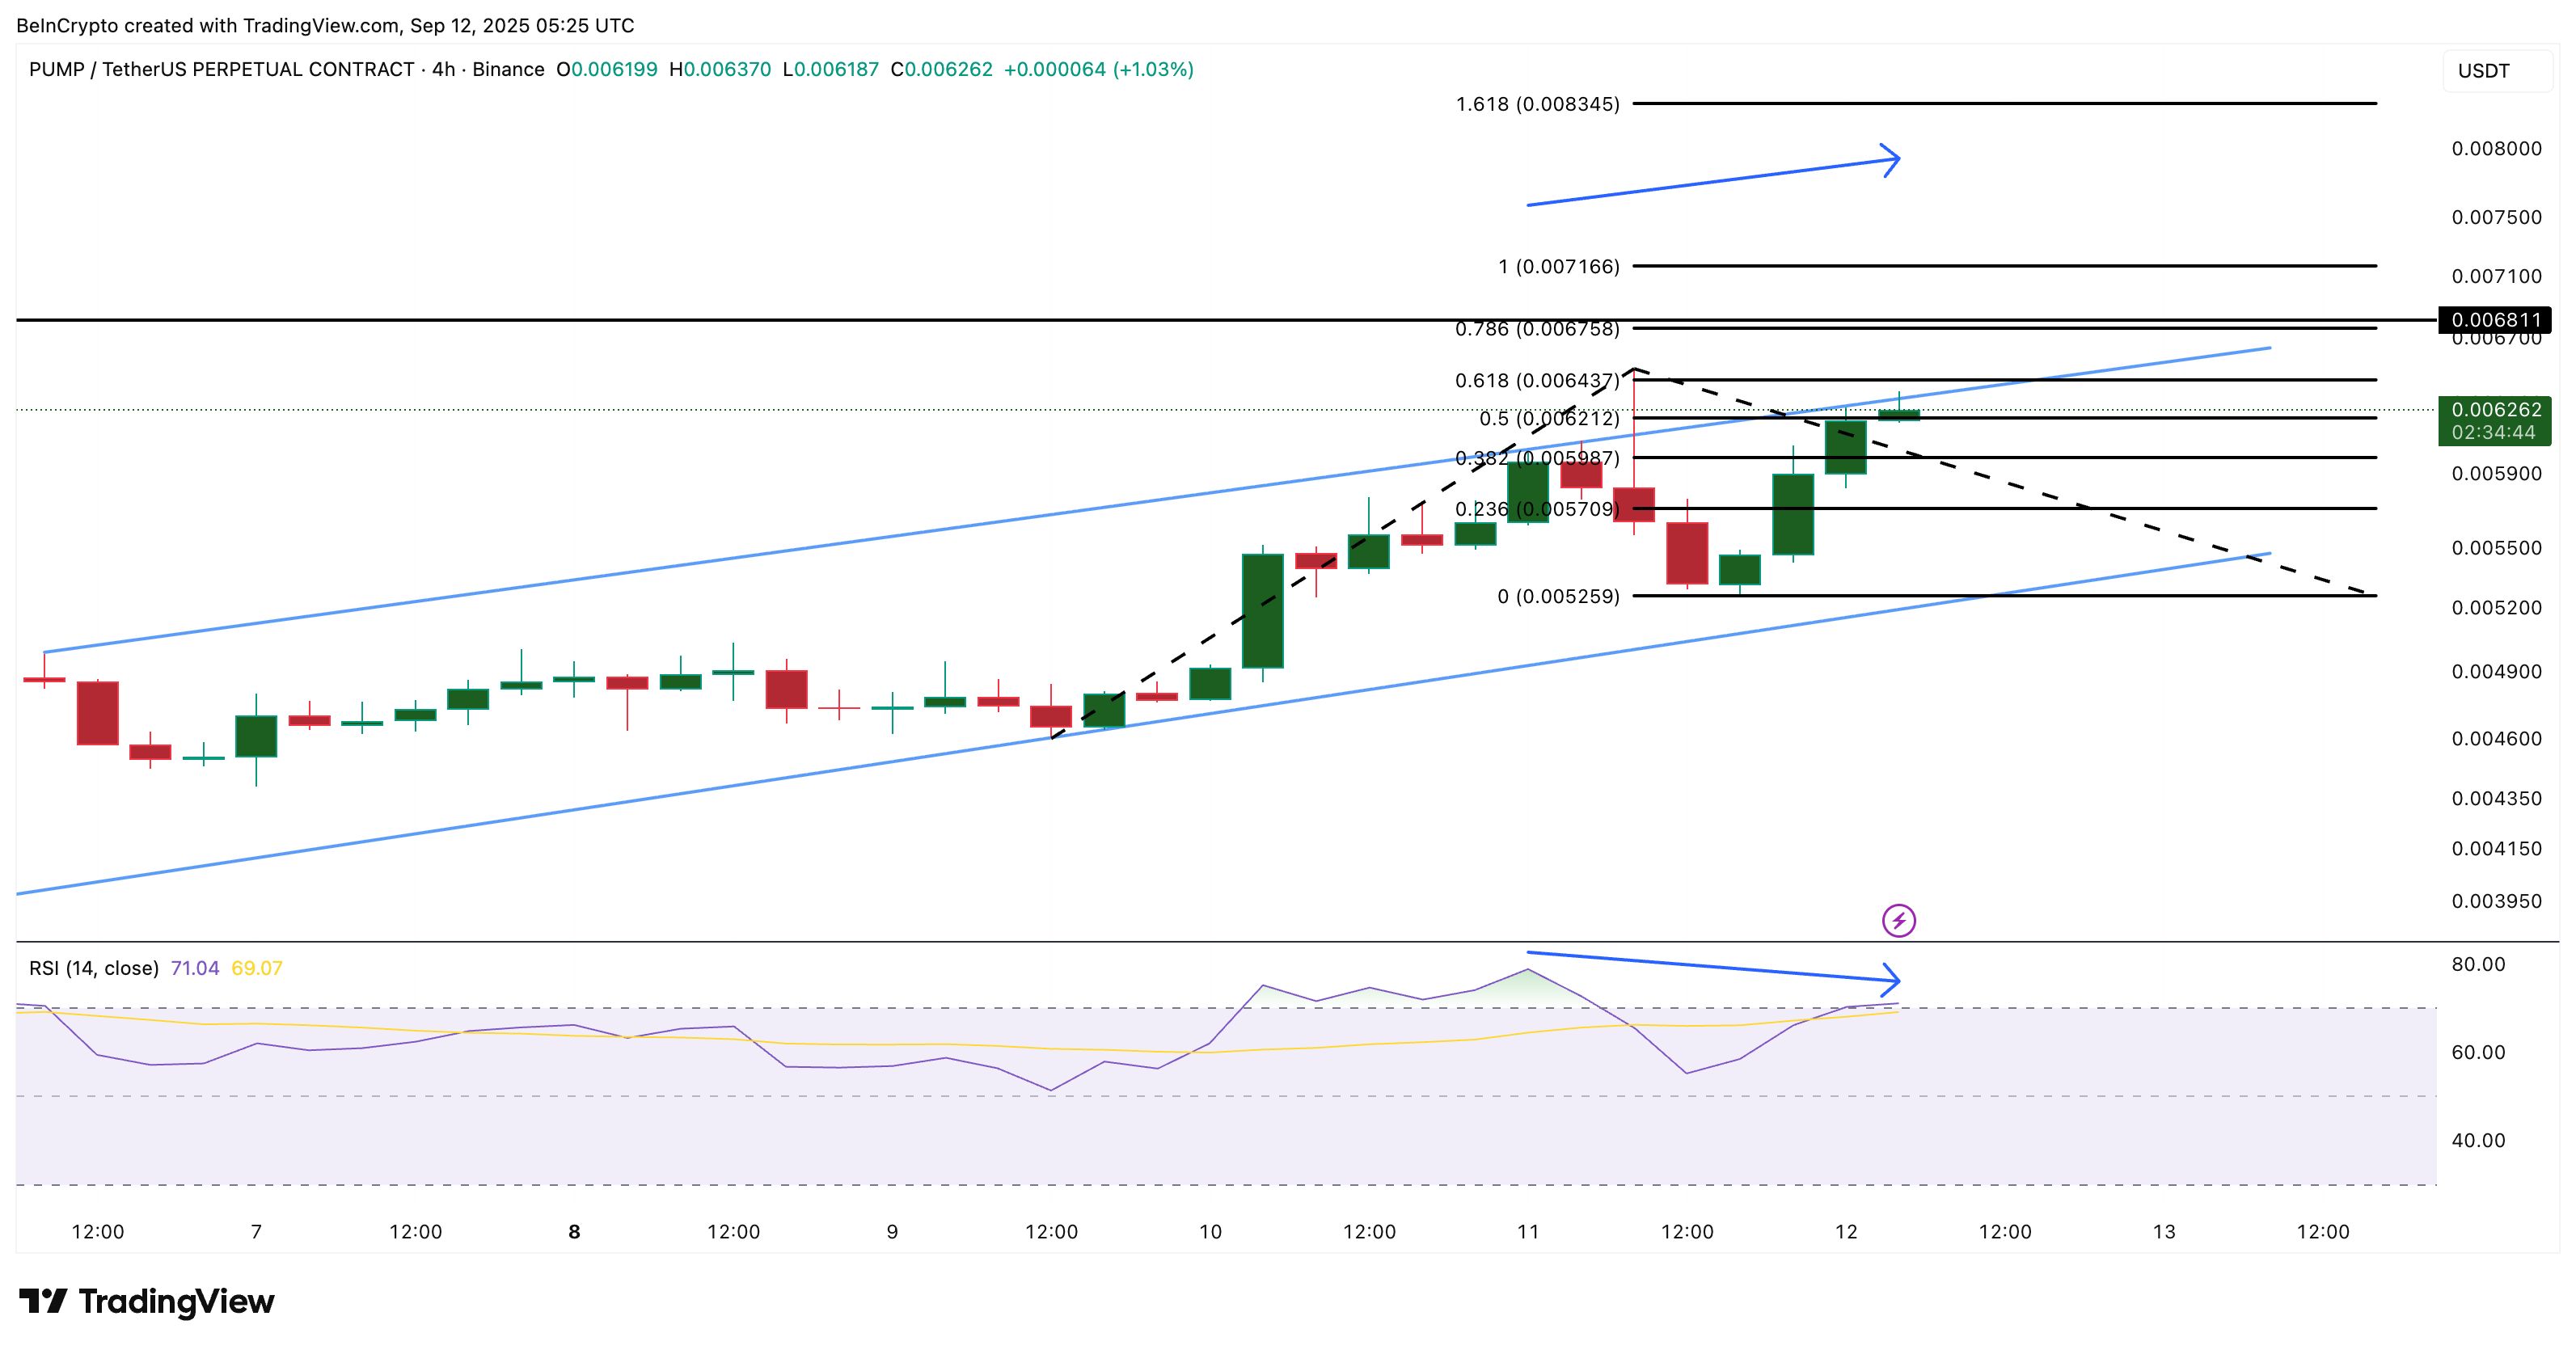 PUMP Price Analysis:
Since September 10, the PUMP price has made higher highs, while RSI has made lower highs. This is called a bearish divergence. On shorter timeframes, such as the 4-hour chart, this typically indicates a pullback or sideways movement rather than a complete reversal. Essentially, it signals that momentum is lagging behind price.
If such a pullback occurs, support zones are located near $0.0059 and $0.0057. Holding these levels would reset momentum and cancel out the divergence.
But if PUMP clears a clean 4-hour candle close above $0.0064, momentum would confirm again, opening a path to retest the all-time high above at $0.0068. Post that, the key targets, in the price discovery zone, sit around $0.0071 and potentially $0.0083
Disclaimer: The content of this article solely reflects the author's opinion and does not represent the platform in any capacity. This article is not intended to serve as a reference for making investment decisions.
You may also like
After Pectra comes Fusaka: Ethereum takes the most crucial step towards "infinite scalability"
The Fusaka hard fork is a major Ethereum upgrade planned for 2025, focusing on scalability, security, and execution efficiency. It introduces nine core EIPs, including PeerDAS, to improve data availability and network performance. Summary generated by Mars AI. The accuracy and completeness of this summary are still being iteratively updated by the Mars AI model.

Decoding VitaDAO: A Paradigm Revolution in Decentralized Science

Mars Morning News | ETH returns to $3,000, extreme fear sentiment has passed
The Federal Reserve's Beige Book shows little change in U.S. economic activity, with increasing divergence in the consumer market. JPMorgan predicts a Fed rate cut in December. Nasdaq has applied to increase the position limit for BlackRock's Bitcoin ETF options. ETH has returned to $3,000, signaling a recovery in market sentiment. Hyperliquid has sparked controversy due to a token symbol change. Binance faces a $1 billion terrorism-related lawsuit. Securitize has received EU approval to operate a tokenization trading system. The Tether CEO responded to S&P's credit rating downgrade. Large Bitcoin holders are increasing deposits to exchanges. Summary generated by Mars AI. The accuracy and completeness of this summary are still being iteratively improved by the Mars AI model.