Bitcoin Price at Risk Despite September Bounce — 3 Warning Signs Emerge for BTC

Bitcoin price is holding near $111,800 after a solid start to September, but on-chain and chart signals suggest defending $110,500 may be tougher than it looks.
Bitcoin is holding near $112,100, up about 1% in the past week. The move from $107,200 to $112,100 shows September kicked off with some relief after August’s over 6% drop. Traders welcomed the bounce, but the bigger picture still leans negative.
Bitcoin is down about 9% month-on-month, and fresh signals suggest the bears are not done yet. The question is simple: can Bitcoin defend $112,000, or will the trend roll back over?
Long-Term Holders Are Cutting Back While Whales Return To Exchanges
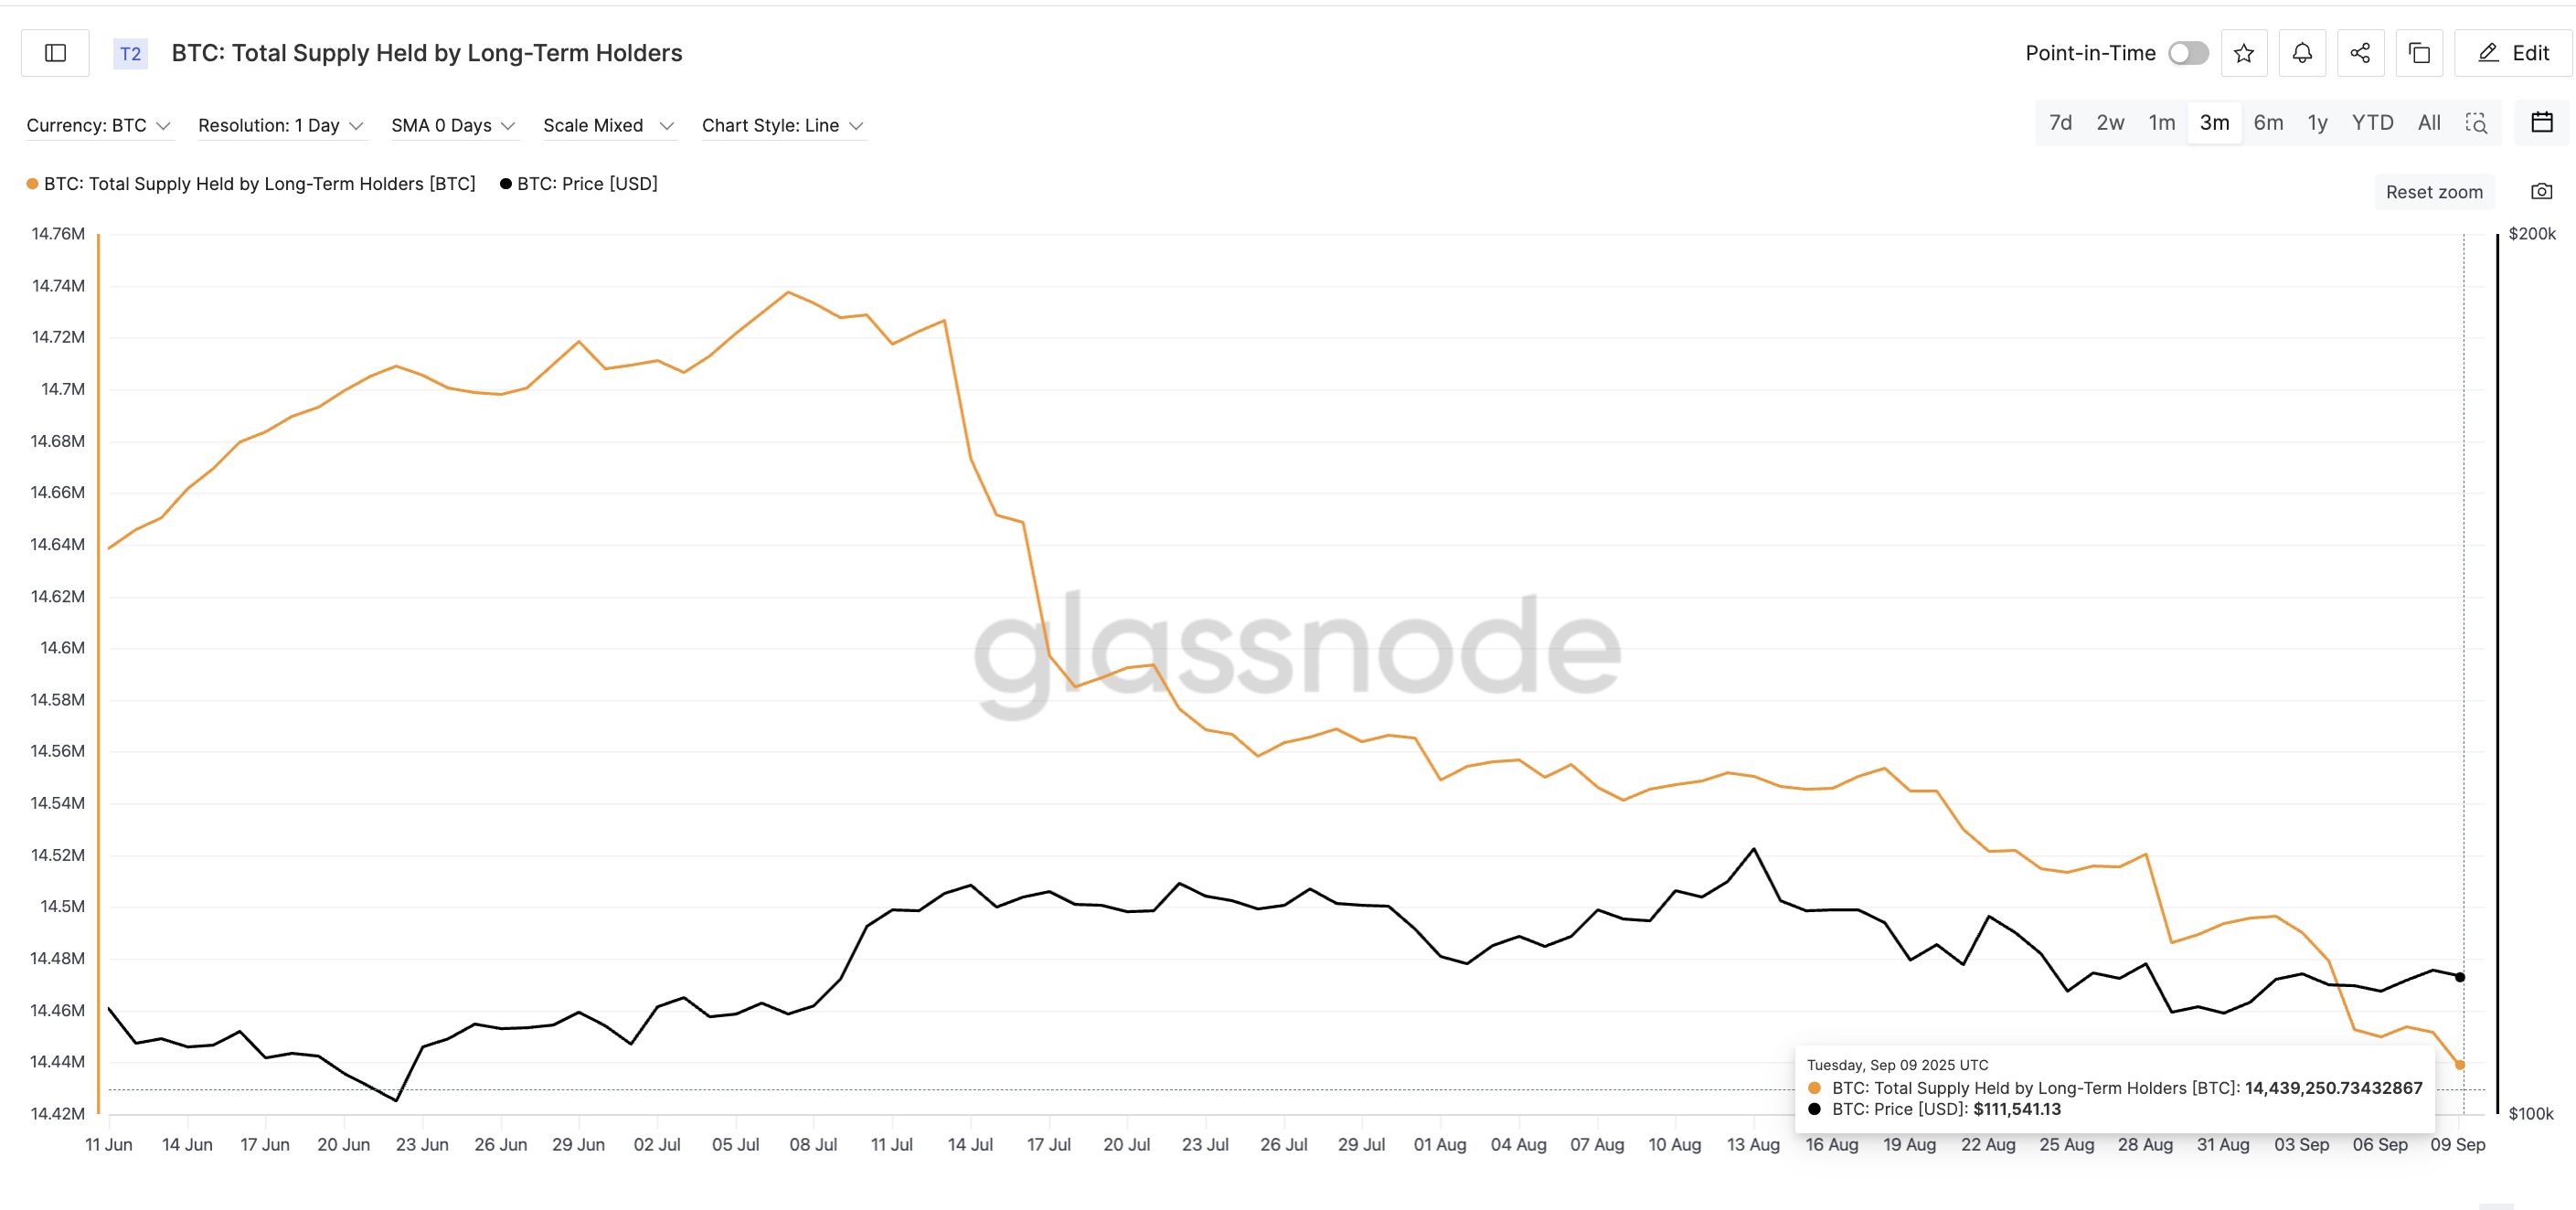
The first warning sign comes from long-term holders. These wallets usually build conviction and rarely sell into weakness. But that picture has changed since mid-July.
On July 13, they held 14.72 million BTC. By early September, that number had slid to 14.43 million BTC, the lowest in three months.
Roughly 290,000 BTC, leaving strong hands, is not a small figure; it shows that even patient holders are reducing risk or selling into each price rebound.
 Bitcoin Long-Term Holders Dropping Supply:
Glassnode
Bitcoin Long-Term Holders Dropping Supply:
Glassnode
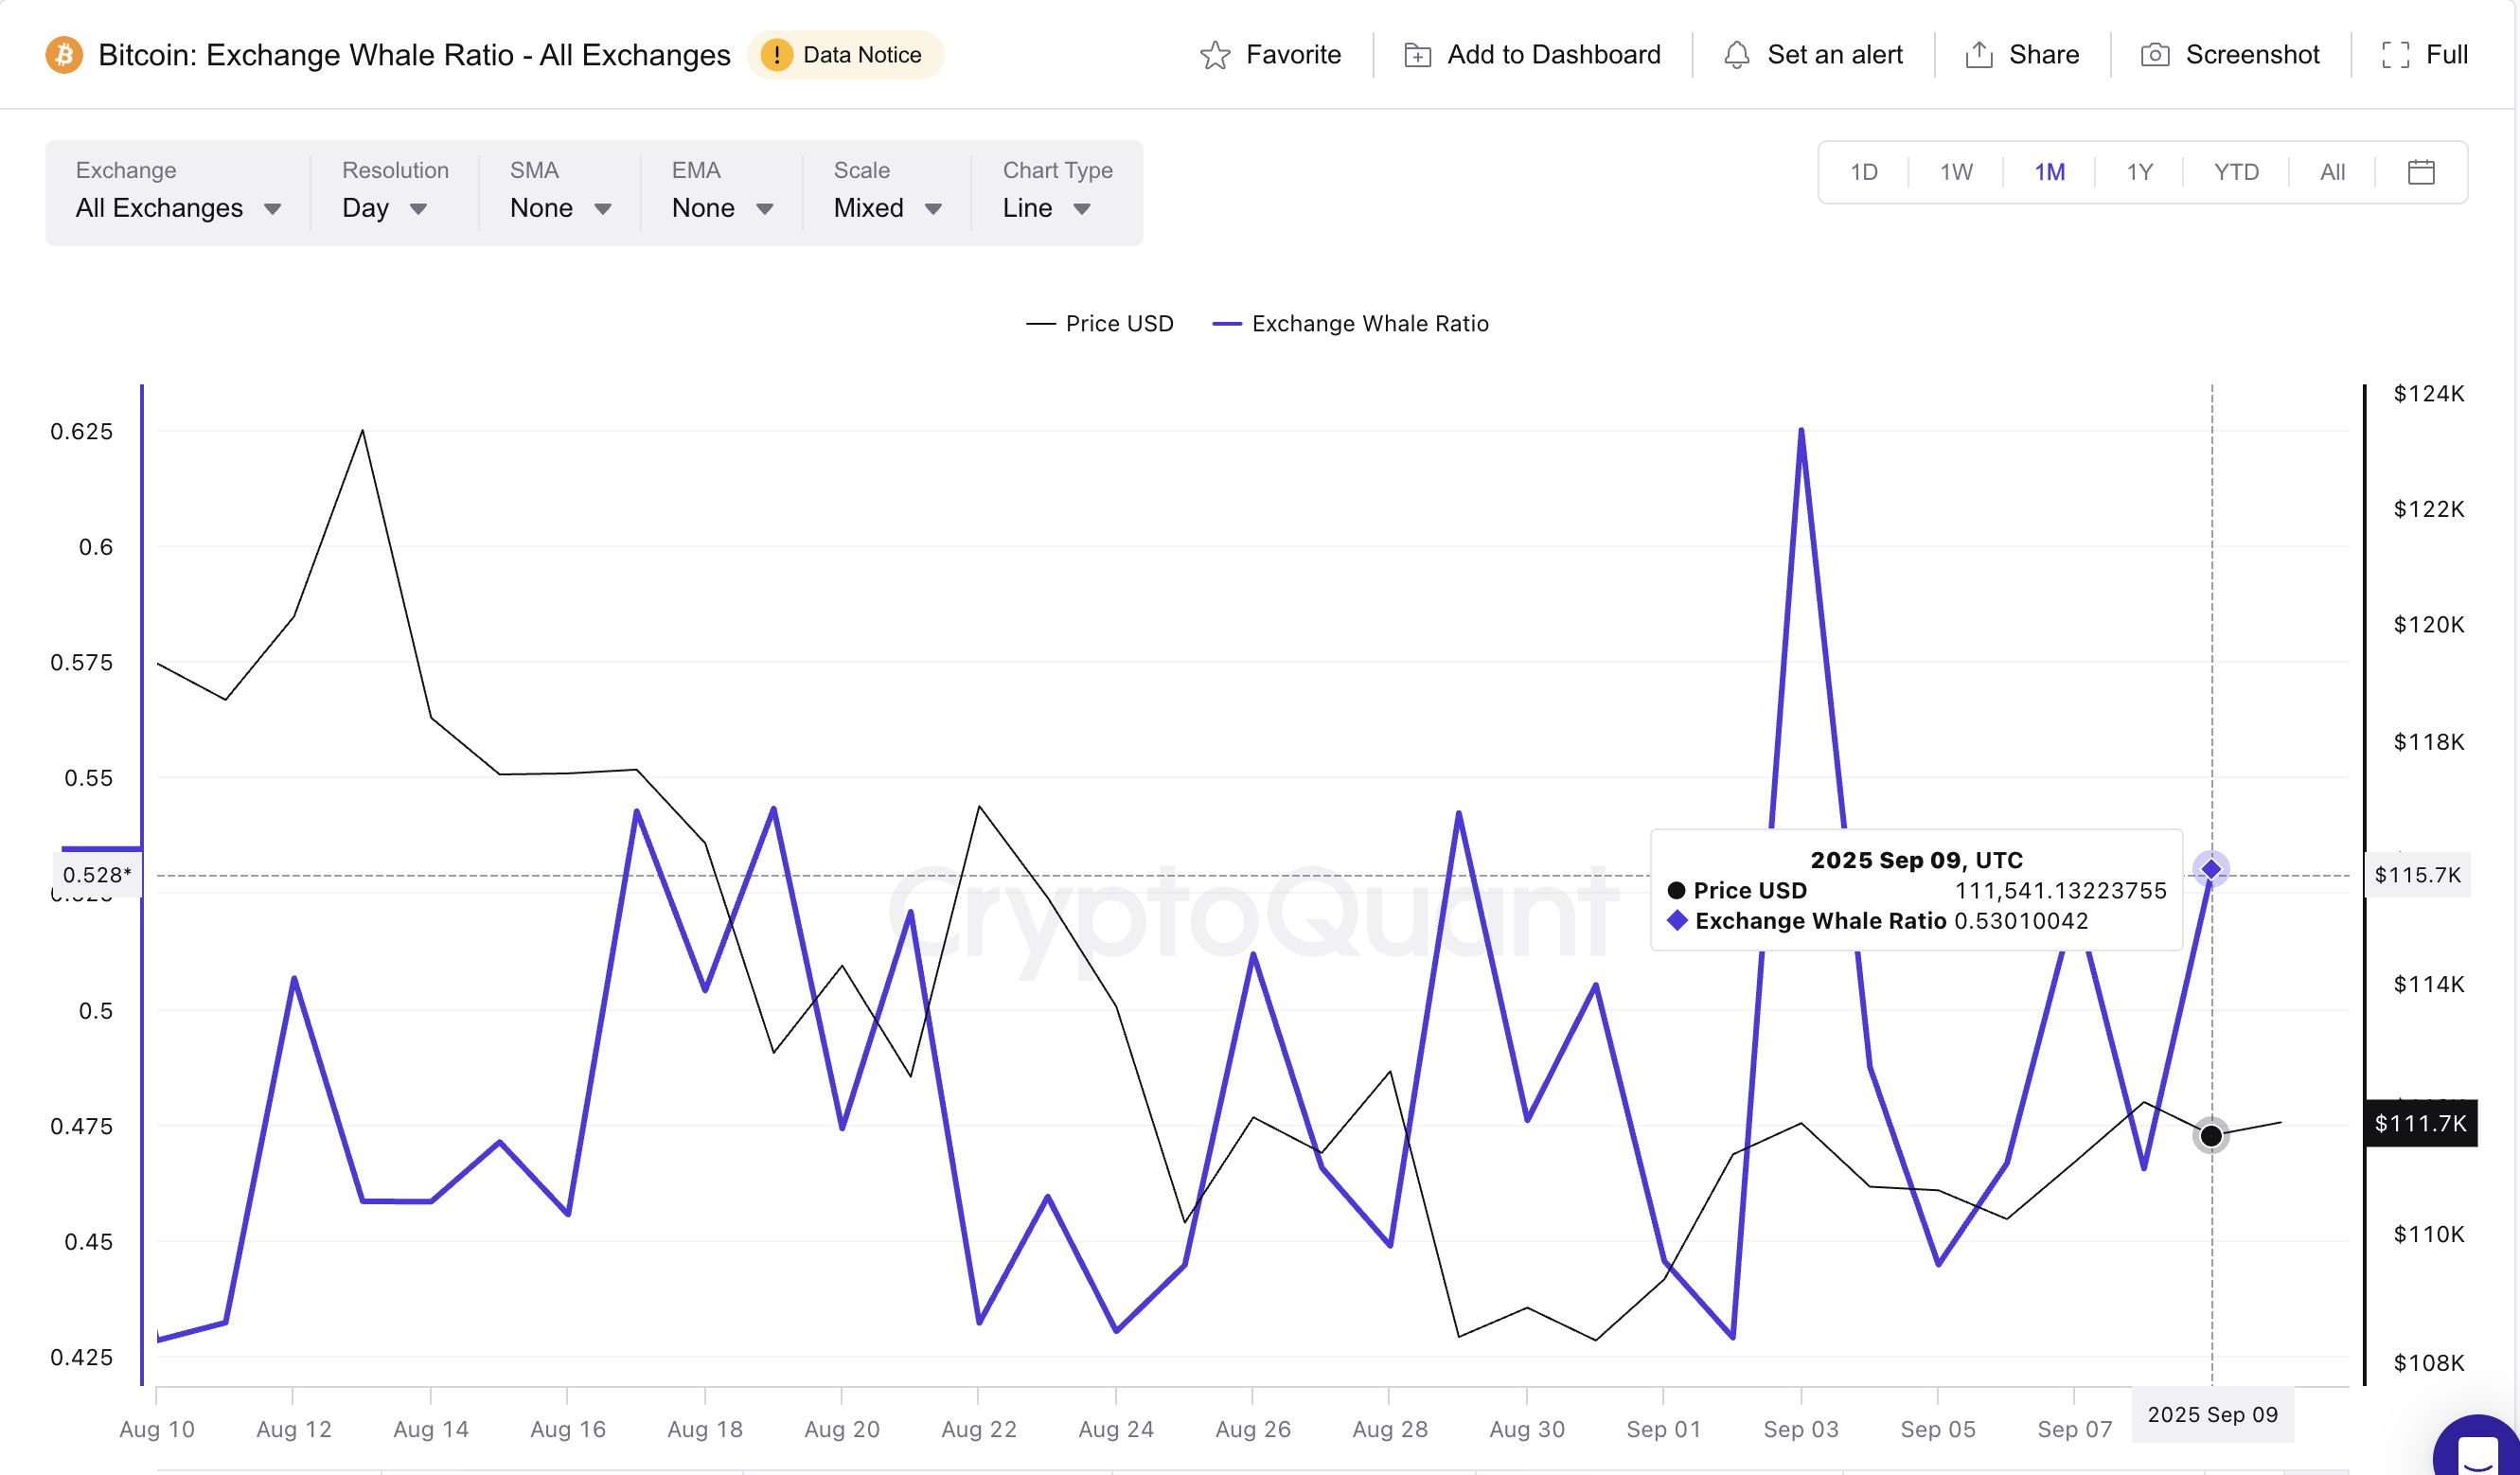
Meanwhile, whales are back in the spotlight. The exchange whale ratio — which tracks how much of the inflows come from the 10 largest wallets — has climbed from 0.44 on September 5 to 0.53 at press time.
The last time it hit similar levels, on August 21, Bitcoin dropped from $116,900 to $108,300 within the next few days.
 Bitcoin Whales Keep Pushing BTC To Exchanges:
CryptoQuant
Bitcoin Whales Keep Pushing BTC To Exchanges:
CryptoQuant
Want more token insights like this? Sign up for Editor Harsh Notariya’s Daily Crypto Newsletter here.
The monthly Exchange Whale ratio chart also highlights something interesting. It shows that whales have not let up over the past 30 days, moving BTC to exchanges even on the smallest of price rises. The multiple local indicator peaks can validate this.
Put together, long-term holders trimming their stash and whales pushing coins onto exchanges repeatedly is not a bullish mix. It signals that supply is being readied in case prices weaken further.
Bearish Divergence On The Bitcoin Price Chart Backs The Case
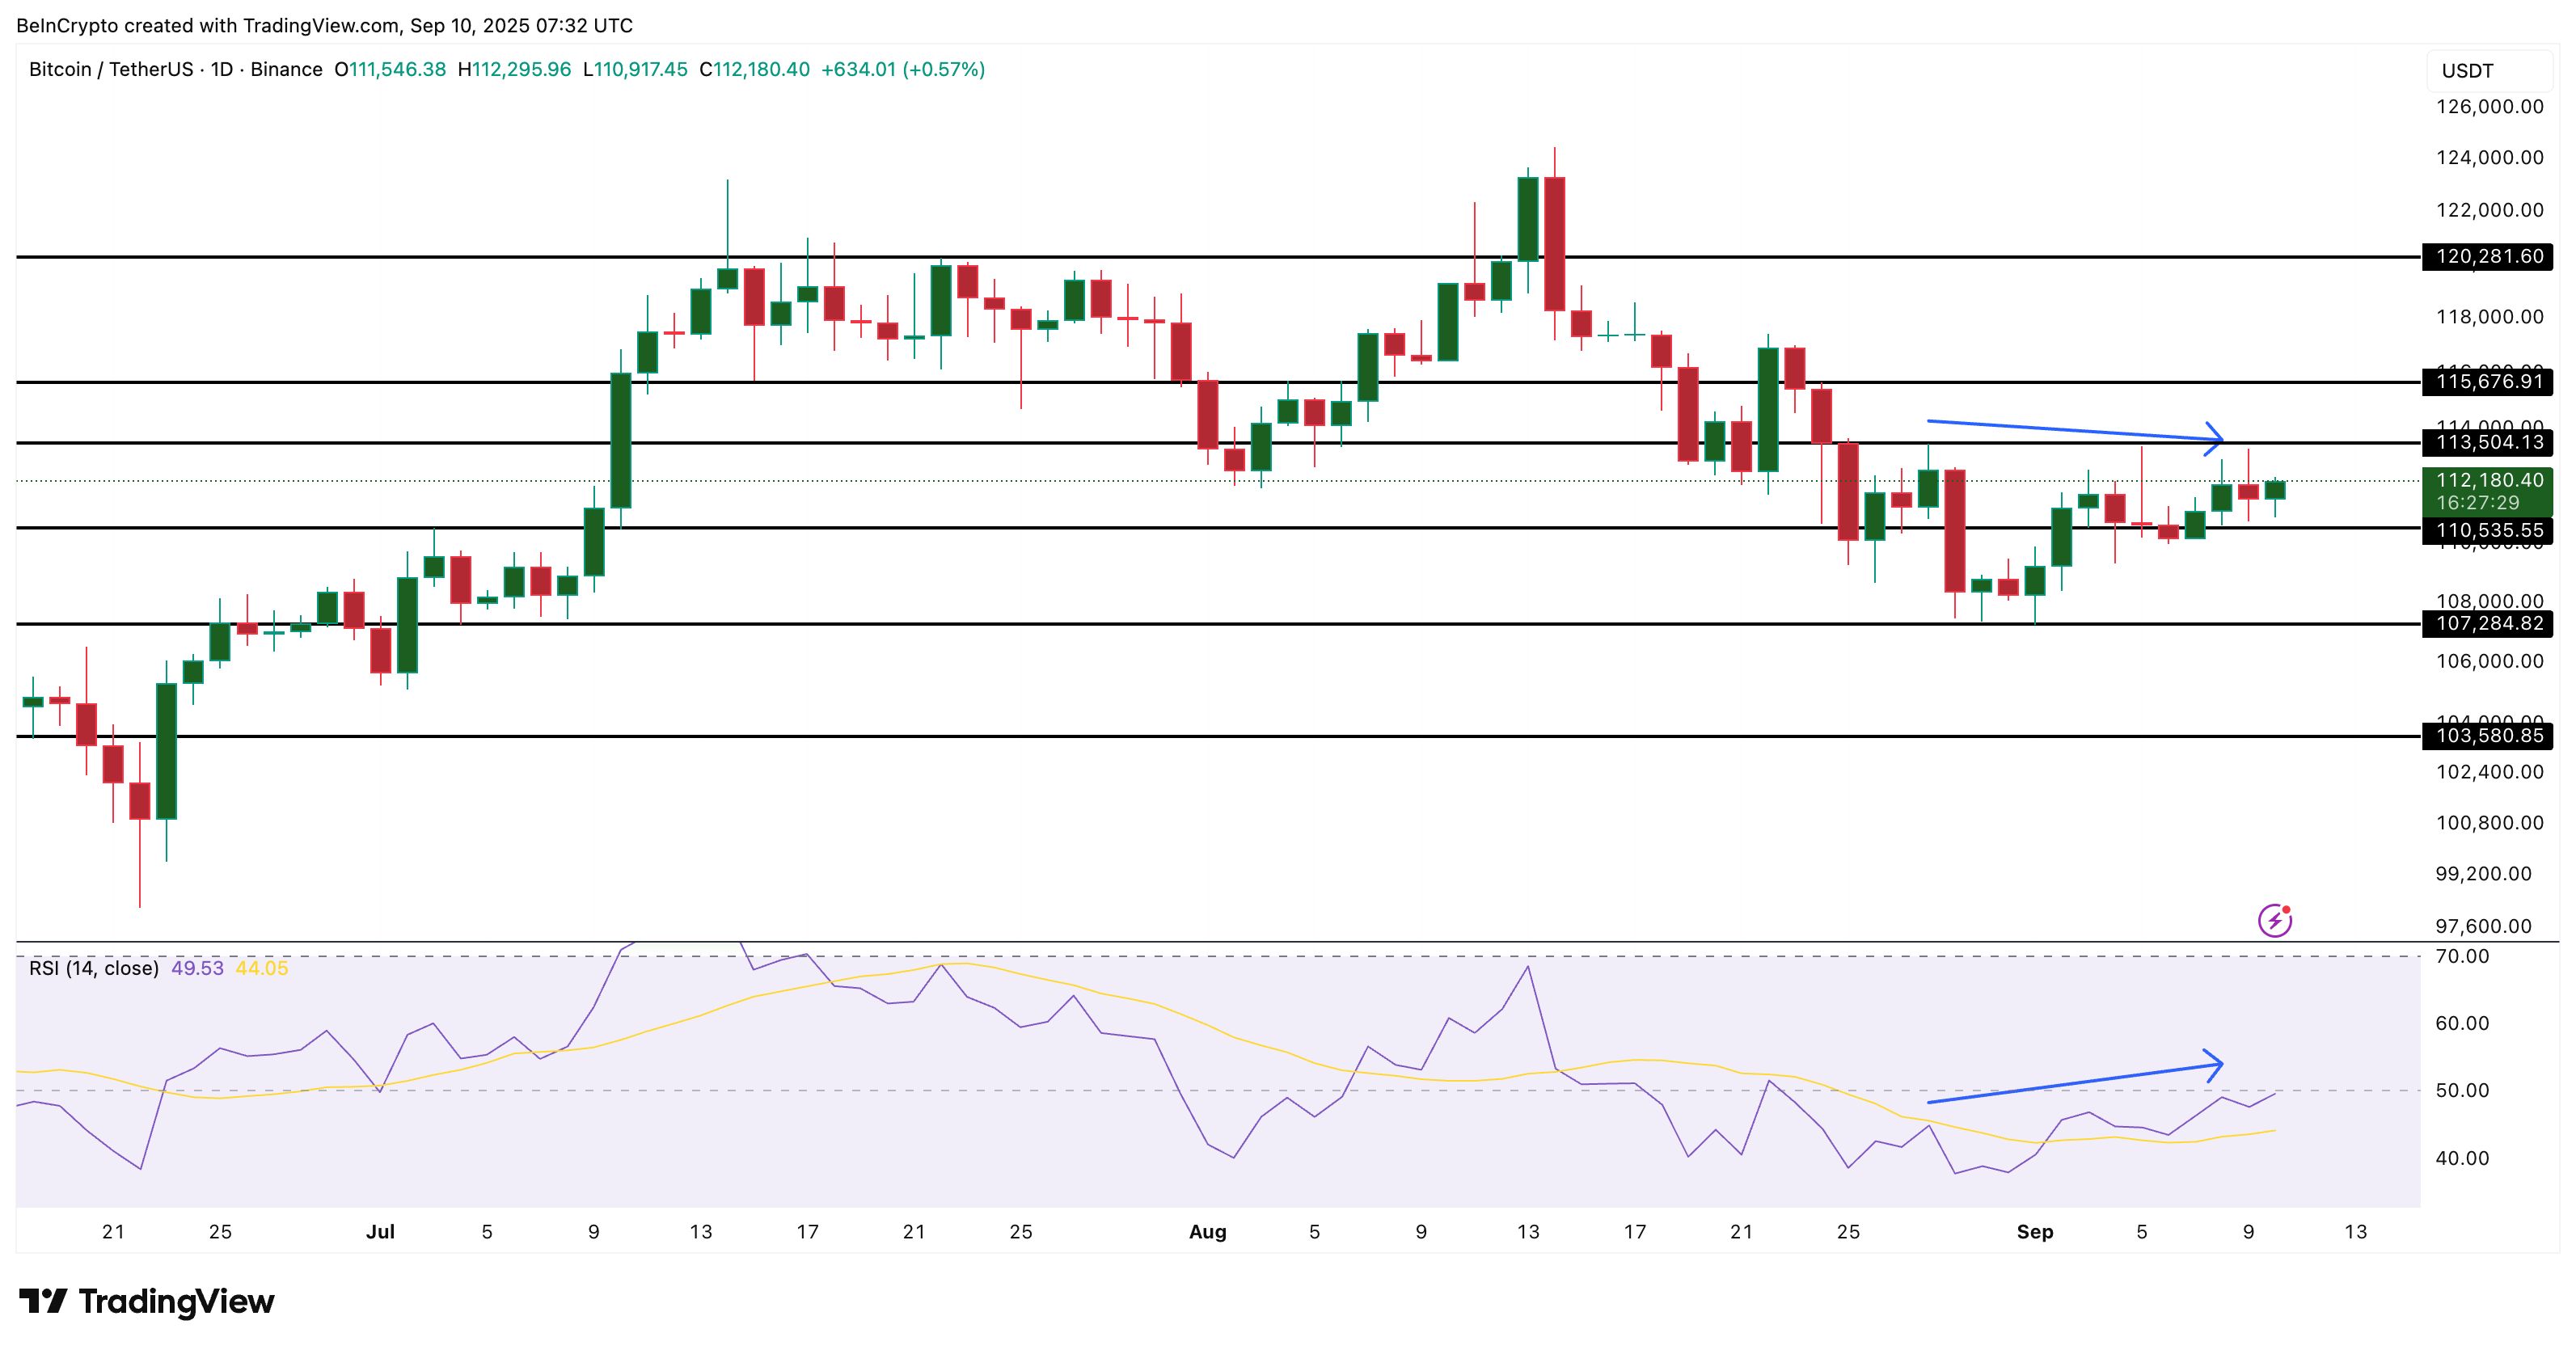
The on-chain data lines up with the Bitcoin price chart. Between August 28 and September 8, Bitcoin’s price made lower highs, while the Relative Strength Index (RSI) — a gauge of buying momentum — printed higher highs. This mismatch is called a hidden bearish divergence.
 Bitcoin Price Analysis:
TradingView
Bitcoin Price Analysis:
TradingView
In other words, momentum looks like it’s improving, but the price action fails to follow. That often sets up the next leg lower.
For traders, the pattern usually warns of trend continuation to the downside, which could mean an extension of BTC’s month-on-month downtrend, as it’s down almost 9% in that timeframe.
The key level to defend for the Bitcoin price is $110,500. If that cracks, led by the bearish divergence and selling pressure, the door opens to $107,200, and if pressure builds, even $103,500 could come back into play.
On the other hand, a close above $113,500 would invalidate the RSI-led bearishness and give the bulls back control.
Disclaimer: The content of this article solely reflects the author's opinion and does not represent the platform in any capacity. This article is not intended to serve as a reference for making investment decisions.
You may also like
OracleX Global Public Beta: Restructuring Prediction Market Incentive Mechanisms with "Proof of Behavior Contribution"
OracleX is a decentralized prediction platform based on the POC protocol. It addresses pain points in the prediction market through a dual-token model and a contribution reward mechanism, aiming to build a collective intelligence decision-making ecosystem. Summary generated by Mars AI The content of this summary is produced by the Mars AI model, and its accuracy and completeness are still being iteratively improved.
Bitcoin is not "digital gold"—it is the global base currency of the AI era
The article refutes the argument that bitcoin will be replaced, highlighting bitcoin's unique value as a protocol layer, including its network effects, immutability, and potential as a global settlement layer. It also explores new opportunities for bitcoin in the AI era. Summary generated by Mars AI. This summary was produced by the Mars AI model, and the accuracy and completeness of its content are still being iteratively improved.

Bitcoin 2022 bear market correlation hits 98% as ETFs add $220M

Fed rate-cut bets surge: Can Bitcoin finally break $91K to go higher?