Is the index repeating history? Risks accumulating behind new highs

(This article includes classic case studies: 1. American Airlines_AAL; 2. Olin_OLN.)
I. Weekly Market Review: (09.02~09.05)
This week had only 4 trading days. The opening price on Tuesday was 6,401.51 points, the lowest price on Tuesday was 6,360.58 points, the highest price on Friday was 6,532.65 points, and the final closing price was 6,481.50 points. The weekly amplitude was 172.07 points, with a weekly increase of 0.33%. The weekly chart closed with a small bullish candlestick above the 5-week moving average, setting a new historical high for the S&P index.
From April 7 to September 5, the index has risen for 22 consecutive weeks, totaling 105 trading days, with a cumulative maximum increase of about 35.11%.
S&P 500 Index Weekly Chart: (Momentum Quantitative Model * Sentiment Quantitative Model)
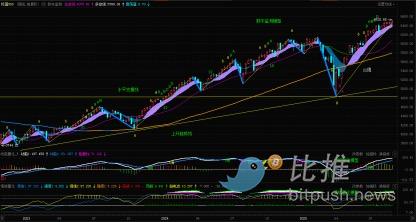
(Figure 1)
S&P 500 Index Daily Chart:
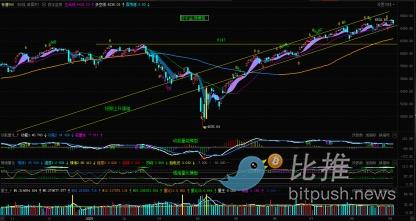
(Figure 2)
S&P 500 Index Weekly Chart: (Historical Data Backtest: March 6, 2009 to April 4, 2025)
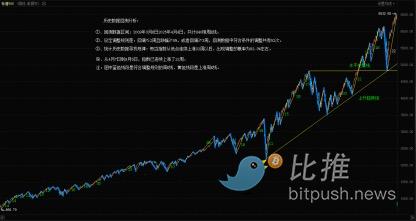
(Figure 3)
The title of my article last week was "Be Alert! S&P Index Oscillates at Highs, Impact Imminent!" In the article, based on the resonance of multi-period technical indicators and backtesting of over a decade of historical data, I made predictions for this week's index.
Regarding the index trend:
1. The index is operating within the upward channel formed after May 2. I predicted that the index would retest the lower boundary of the channel this week, paying attention to the support effect of the lower boundary.
2. The resistance above the index is near the upper boundary of the channel; the first support below is near the lower boundary of the channel, the second support is near 6,300 to 6,340 points, and the key support is in the 6,200 to 6,147 points area.
Regarding trading strategies:
1. The main task for investors this week is to control positions, reduce trading frequency, and mainly observe.
2. Total position should be controlled at around 50%, with the other half in cash on the sidelines. If the index falls below the lifeline channel, positions should be reduced to below 30%.
2. For short-term traders, a small portion of the holdings can be used for "short-term arbitrage" based on the given support and resistance levels.
Now, let's review the actual trend this week:
On Tuesday, the index opened at 6,401.51 points, down about 1%, with the opening price below the lower boundary of the channel. The index then quickly fell, bottoming at 6,360.58 points before rebounding in a choppy manner. The maximum drop that day was 1.57%. It finally closed with a "false bullish" candlestick with a lower shadow, down 0.69%, with the closing price near the lower boundary of the channel;
On Wednesday, the index opened slightly higher near the upper side of the lower boundary of the channel, then oscillated narrowly above the lower boundary, and closed with a small bullish candlestick with a lower shadow, up 0.51% that day;
On Thursday, the index oscillated higher after the open, closing with a small bullish candlestick up 0.83% that day;
On Friday, the index opened higher due to market news, then quickly fell, stabilized near the lower boundary of the channel, and then oscillated narrowly at the low. It closed with a bearish candlestick, opening high and closing low, down 0.32% that day.
This week, the index "jumped up and down" around the lower boundary of the channel, and the trend was roughly in line with my prediction last week.
Next, I will use multi-period technical indicators to analyze the current changes in the index.
(1) Quantitative Model Signal Analysis:
1. Weekly Perspective (see Figure 1):
① Momentum Quantitative Model: Maintains a high-level stagnation state, the momentum line 1 is rising at a slower pace, the two momentum signal lines are slowly narrowing, and the energy (red) bar continues to shorten compared to last week.
Model indicates downside risk index: High
② Sentiment Quantitative Model: Sentiment 1 indicator strength is about 4.20 (range 0~10), sentiment 2 strength is about 4.23, and the peak signal indicator is 9.44.
Model indicates downside risk index: High
③ Digital Monitoring Model: No signals displayed this week.
2. Daily Perspective (see Figure 2):
① Momentum Quantitative Model: Maintains a high-level stagnation state, the two signal lines are glued together, and the energy bar appears as "sesame dots," indicating the index is facing a directional choice.
Model indicates the index is in a high-level oscillation state, downside risk index: High
② Sentiment Quantitative Model: After Friday's close, sentiment 1 indicator strength is 2.51, sentiment 2 indicator strength is 0, and the peak signal indicator is 3.97.
Model indicates downside risk index: Relatively high
③ Digital Monitoring Model: No top signals displayed.
(2) Trend Sequence and Historical Data Backtest Analysis (Figure 3):
1. My backtesting model:
① Backtest data range: March 6, 2009 to April 4, 2025, a total of 840 weekly K-lines.
② Adjustment rules: pullback ≤ 2 weeks and decline ≥ 5%, or pullback ≥ 3 weeks. There were 52 adjustments in the backtest data that met the criteria.
2. Statistical analysis of historical data to find patterns: Whenever the index rises for 22 consecutive weeks from a low point, the probability of a correction is about 92.3%.
3. From April 7 to September 5, the index has risen for 22 consecutive weeks.
In summary, I will continue to tirelessly remind investors that the index is currently in a high-risk zone. Do not be deceived by the "strong" market, and always remain vigilant.
II. Next Week's Market Forecast: (09.08~09.12)
1. After Friday's close this week, the price is near the upper side of the lower boundary of the channel. This is the sixth time the index has found support near the lower boundary. I predict that the index will retest the lower boundary next week, so please pay attention to the support effect of the lower boundary. If this level is effectively broken, the index's correction will intensify.
2. The resistance above the index is near the upper boundary of the channel; the first support below is near the lower boundary of the channel, the second support is near 6,300 to 6,340 points, and the key support is in the 6,200 to 6,147 points area. If the index effectively breaks below this level, it will mark the end of the rally that began on April 7, and the market may enter a phase of adjustment.
III. Next Week's Trading Strategy: (09.08~09.12)
1. Control positions, reduce trading frequency, and mainly observe.
2. Total position: long positions should be controlled at around 50%, with the other half in cash on the sidelines. If the index falls below the lifeline channel, positions must be reduced to below 30%.
2. For aggressive investors, a small portion of the position can be used for "short-term arbitrage" based on the support and resistance levels I provided.
3. For short-term trading, it is recommended to switch the analysis period to a small cycle of 60 minutes or 120 minutes to obtain more precise entry and exit points.
4. Individual stock trading can also refer to the above trading strategies.
IV. Classic Case Studies: (For case analysis only, not investment recommendations)
1. American Airlines (stock code_AAL): (Long position)
American Airlines (AAL) Daily Chart:
This is a stock I analyzed on August 24:
1. Buy conditions (long): Buy price is $13.10~$13.20, stop loss is $12.45, first target is $15.5~$16, swing trading.
2. This week, American Airlines opened at $13.26. On Wednesday, the stock price surged and then fell back, reaching a high of $14.01, with a maximum increase of about 5%. That day, it closed with a "pin bar" candlestick with a long upper shadow; Thursday was a corrective bearish candlestick, and Friday closed with a stabilizing bullish candlestick; this week closed with a bearish doji candlestick. I will continue to track it next week.
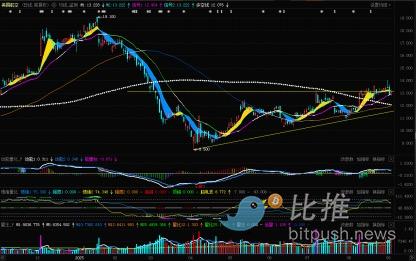
2. Olin (stock code_OLN): (Long position)
Olin (OLN) Daily Chart:
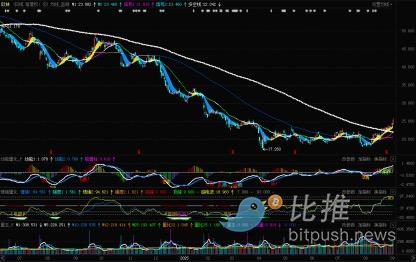
This is a stock I have been tracking since the end of last November as a short position. After more than four months of adjustment, the stock price fell from around $42 to $17.2. From April 3 to September 3, the stock price has been oscillating within a box (between $17.26 and $23.42). In the past two days, the stock price broke above the upper edge of the box at around $23.50 with increased volume. Wait for a pullback on lighter volume after a surge next week to buy on dips.
Buy conditions (long): Buy price is around $24, stop loss is $22.4, first target is around $29, swing trading.
Author: Cody Feng
Disclaimer: The content of this article solely reflects the author's opinion and does not represent the platform in any capacity. This article is not intended to serve as a reference for making investment decisions.
You may also like
Coinpedia Digest: This Week’s Crypto News Highlights | 29th November, 2025
QNT Price Breaks Falling Wedge: Can the Bullish Structure Push Toward $150?

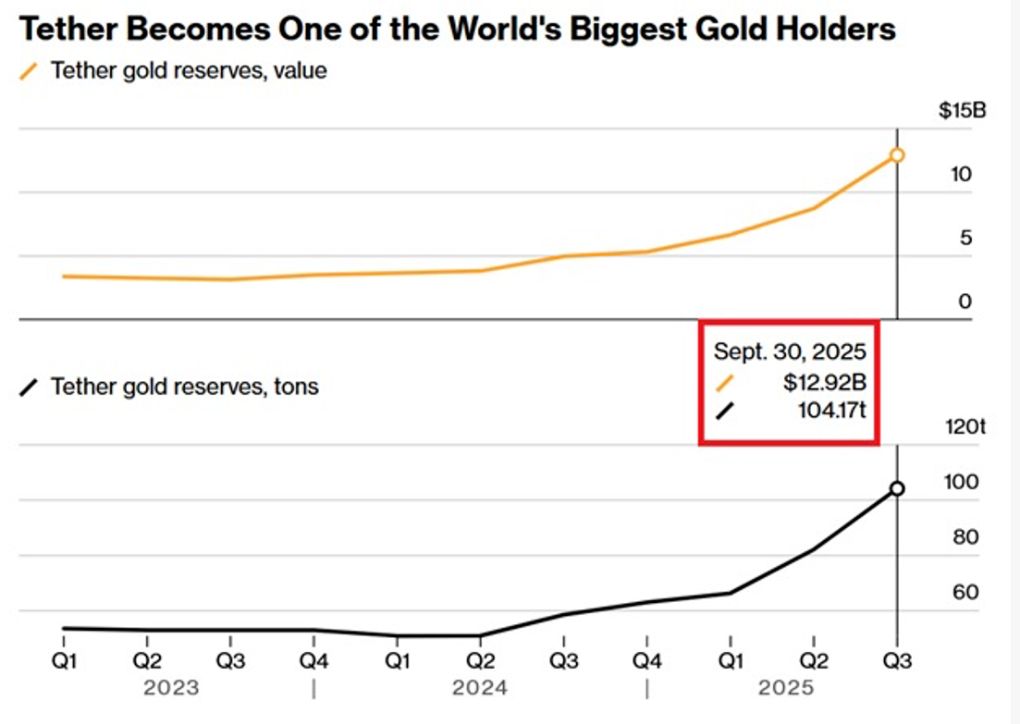
Digital dollar hoards gold, Tether's vault is astonishing!
The Crypto Bloodbath Stalls: Is a Bottom In?