Key Notes
- XRP trades at $2.79 after dropping below the $3 psychological level.
- Ali Martinez says defending $2.70 and breaking $2.90 could lead to $3.70.
- Liquidity mapping shows potential targets up to $4 amid a possible short squeeze.
XRP XRP $2.77 24h volatility: 1.8% Market cap: $164.61 B Vol. 24h: $6.62 B has been under selling pressure , trading at $2.79, down 2% in the past 24 hours and 5% over the past week.
The drop below the psychological $3 level last week rattled some investors, but the sharp 72.39% surge in 24-hour trading volume points to heightened activity and possible accumulation .
Martinez: Defend $2.70, Break $2.90, Then Target $3.70
Crypto analyst Ali Martinez outlined a clear bullish price trajectory for XRP. According to his analysis, XRP must first defend the $2.70 support zone, which has been repeatedly tested in recent sessions.
The chart shared by Martinez shows that holding this level is crucial to prevent a breakdown toward $2.48 (1.272 Fib extension).
Bullish path for $XRP :
– defend $2.70,
– break $2.90,
– then target $3.70. pic.twitter.com/eZbNh3ZP5C— Ali (@ali_charts) September 1, 2025
If buyers manage to sustain this defense, the next step is a breakout above $2.90, which coincides with the 0.786 Fibonacci retracement and descending trendline resistance.
Clearing this threshold could set XRP on a path to $3.14 (0.5 Fib level) and eventually toward Martinez’s upside target at $3.70 (0.236 Fib level).
The dotted path in his chart showed the stair-step nature of this potential rally, with pullbacks likely at $3.05 and $3.26 before a full breakout.
Liquidity Mapping Points to $4
Meanwhile, crypto analyst Steph Is Crypto warned traders to “be prepared,” citing liquidity concentrations extending up to the $4 level.
#XRP Be Prepared!
Watch asap! 👇 pic.twitter.com/YT5ZsxnDjR
— STEPH IS CRYPTO (@Steph_iscrypto) August 29, 2025
He explained that markets usually chase the highest liquidity, suggesting that XRP could be setting up for a short squeeze scenario. In such a case, traders betting against XRP may be forced to cover as price climbs, accelerating bullish momentum.
The fact that XRP hasn’t touched $4 since previous market cycles makes this level both technically and psychologically significant as per the analyst.
XRP Price Analysis: Momentum Indicators at a Crossroads
On the daily chart, XRP is hugging the lower Bollinger Band around $2.72, signaling oversold conditions.
The RSI sits at 41.79, below neutral 50, suggesting bearish momentum while the MACD is flat, with a slight bearish crossover, underscoring market indecision. A bullish flip here would add confirmation to Martinez’s breakout scenario.
If bulls can force a break above $2.90, the technical setup supports a rally toward $3.70 and potentially $4, where liquidity is heavily stacked, making XRP the next crypto to explode .
The CMF at -0.18 indicates capital outflows, though a recovery above zero would be an early sign of returning demand.
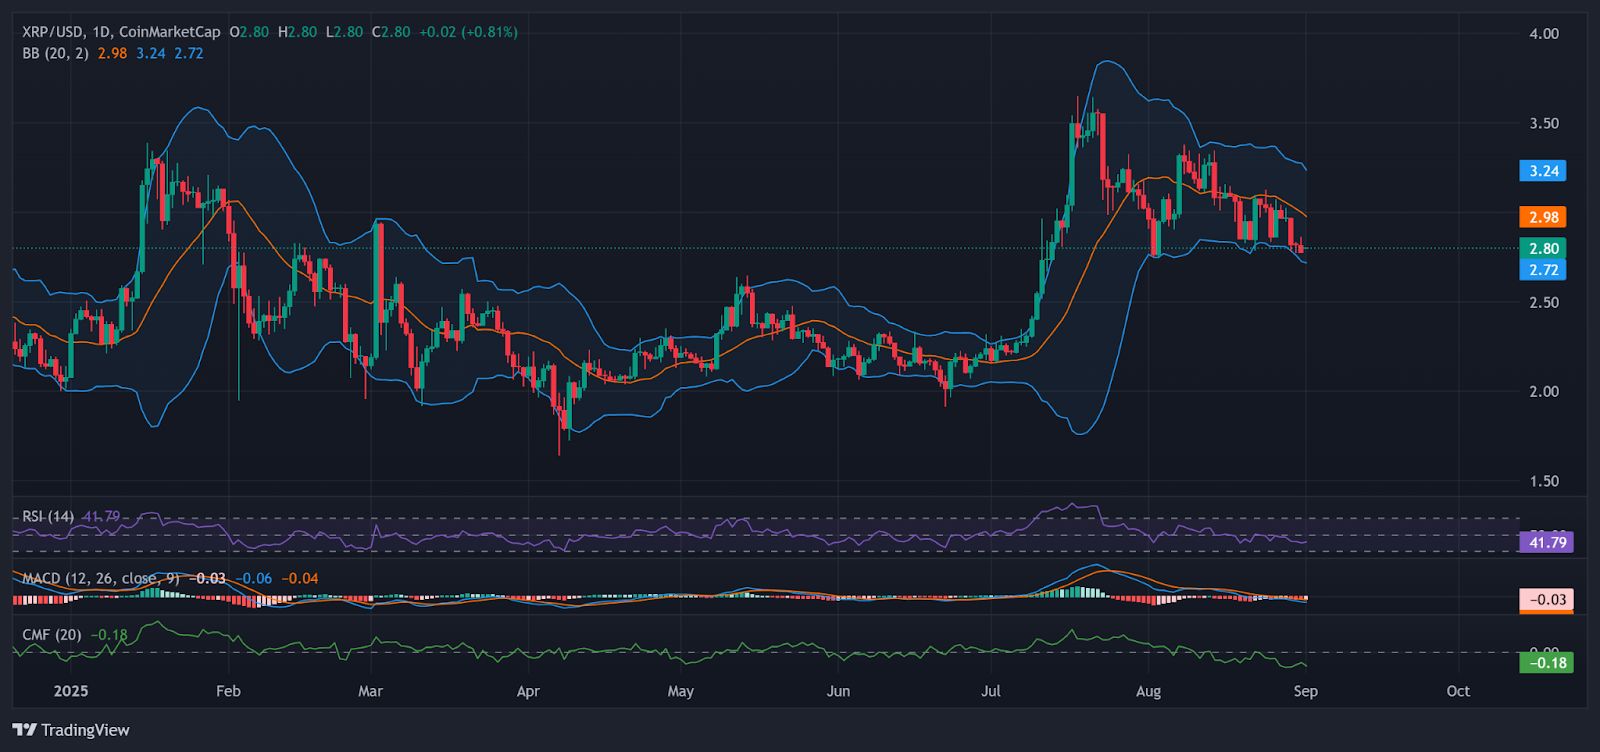
XRP daily chart with momentum indicators. | Source: TradingView
Overall, XRP is at a decisive juncture. Holding the $2.70 floor is important to prevent deeper losses.