Date: Sat, Aug 30, 2025 | 07:10 AM GMT
The cryptocurrency market has once again entered choppy waters as Ethereum (ETH) slipped to $4,400 from its recent high of $4,954, marking a 7% weekly decline. The broader pullback has pressured major altcoins , including XDC Network (XDC).
However, XDC is showing relative strength, posting a 4% intraday gain, trimming its weekly losses to 5%. Even more importantly, the price chart is signaling a harmonic setup that could lay the foundation for a potential reversal.
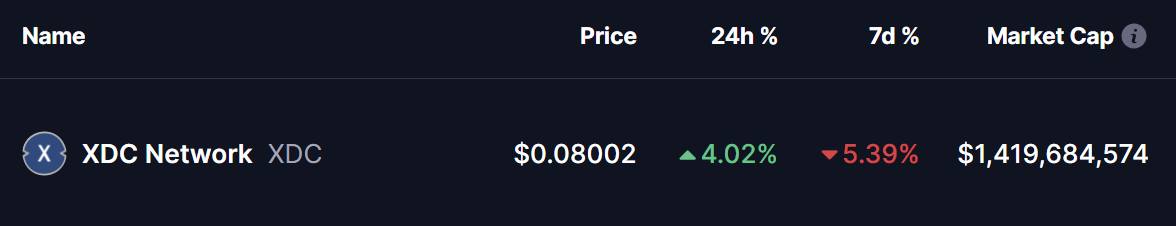 Source: Coinmarketcap
Harmonic Pattern Taking Shape
On the daily chart, XDC is forming a Bearish ABCD harmonic pattern. Despite its name, this setup often features a bullish CD-leg rally before price reaches its Potential Reversal Zone (PRZ).
The structure began with a rally from Point A ($0.05728) to Point B, followed by a retracement down to Point C ($0.07574), where buyers defended the 200-day moving average (MA). From there, XDC has bounced back to around $0.08017, signaling that the CD-leg may now be unfolding.
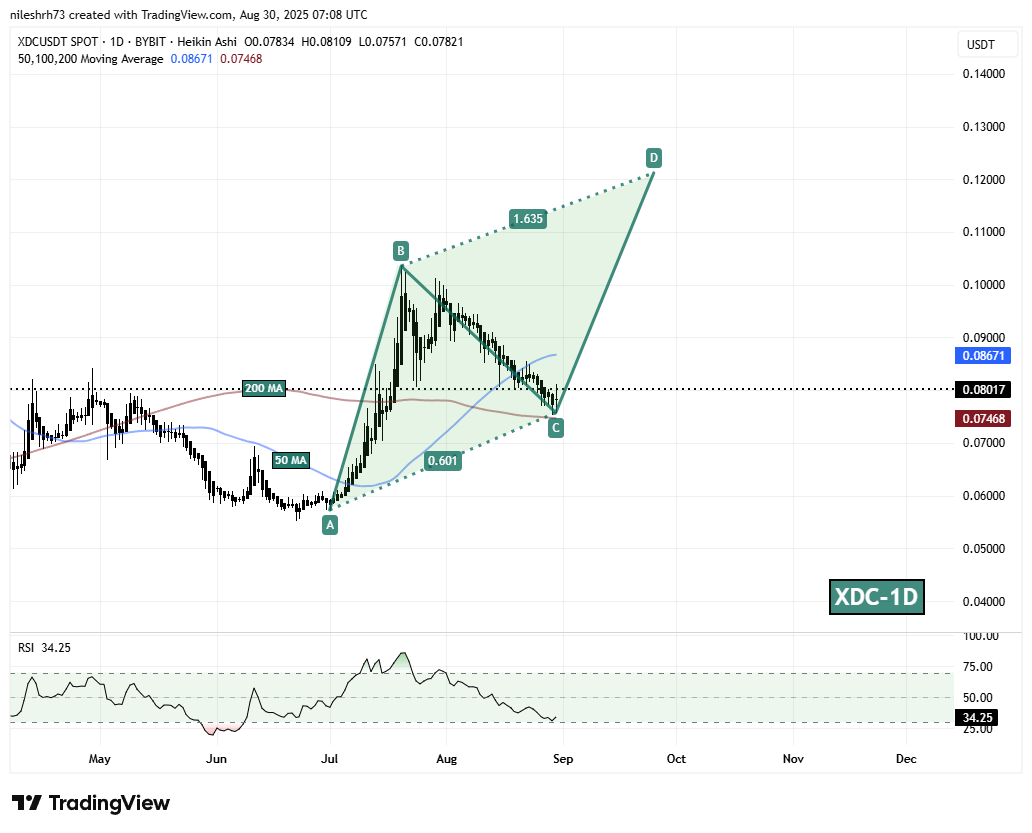 XDC Network (XDC) Daily Chart/Coinsprobe (Source: Tradingview)
A key resistance lies at the 50-day MA ($0.08671). A breakout and hold above this level would strengthen the bullish case, potentially confirming the harmonic structure.
What’s Next for XDC?
If bulls succeed in reclaiming the 50-day MA, XDC could advance toward the 1.63 Fibonacci PRZ at $0.1212 — a move that represents more than a 50% upside from current levels.
On the downside, failure to hold above the 200-day MA support near $0.07468 could invalidate the pattern, exposing the token to renewed bearish pressure.