$10B Wiped Out: Can XRP Recover From This Crash?
XRP just erased more than $10 billion in market cap in a single day, dropping 5% as technical weakness and macroeconomic uncertainty weighed heavily on the token. The decline pushed XRP price below the $3 psychological threshold to $2.84, underperforming the broader market’s 3.35% drop. Let’s break down what’s really happening here and where XRP could go next.
XRP Price Prediction: Why Did XRP Crash Below $3?
The selloff was triggered by two major forces. First, technical breakdown: XRP failed to hold its $3.05 support and sliced through the $3 floor, which was a key psychological and Fibonacci level. Once that gave way, sellers piled in and momentum shifted rapidly downward.
Second, sentiment around an XRP spot ETF turned shaky. While CME XRP futures open interest climbed above $1 billion at record speed—a bullish sign—the optimism was tempered by wider market risk aversion and regulatory ambiguity. Traders are unsure whether approval will come quickly, and that hesitation fed into selling pressure.
Analyst Calls: From Bullish to Bearish
On-chain analyst Ali Martinez had initially projected a fast recovery to $3.70, but reality caught up quickly. By August 28, Martinez aligned his outlook with the market, noting XRP was retracing toward $2.83 as expected. That shift from bullish optimism to bearish confirmation underscores how fragile XRP sentiment has become.
The market now views $2.70 as the more realistic short-term target, rather than the $3.70 rally Martinez once highlighted.
Macro Headwinds: The US Economy and Trump’s Tariffs
Layered on top of XRP’s chart weakness are macroeconomic shifts that ripple across all risk assets. US GDP grew at 3.3% in Q2 , stronger than first reported, driven by business investment and trade. Yet, the growth comes in the shadow of President Trump’s escalating trade wars. Tariffs are starting to push inflation back into the picture, which Fed Chair Jerome Powell acknowledged at Jackson Hole.
Traders are betting on a Fed rate cut next month, but if tariffs keep inflation sticky, the Fed could hesitate. That uncertainty has left crypto markets in limbo. A resilient US dollar and rising Treasury yields weigh on XRP because risk appetite shrinks whenever monetary policy feels unpredictable.
Technical Breakdown: Where Are the Key Levels?
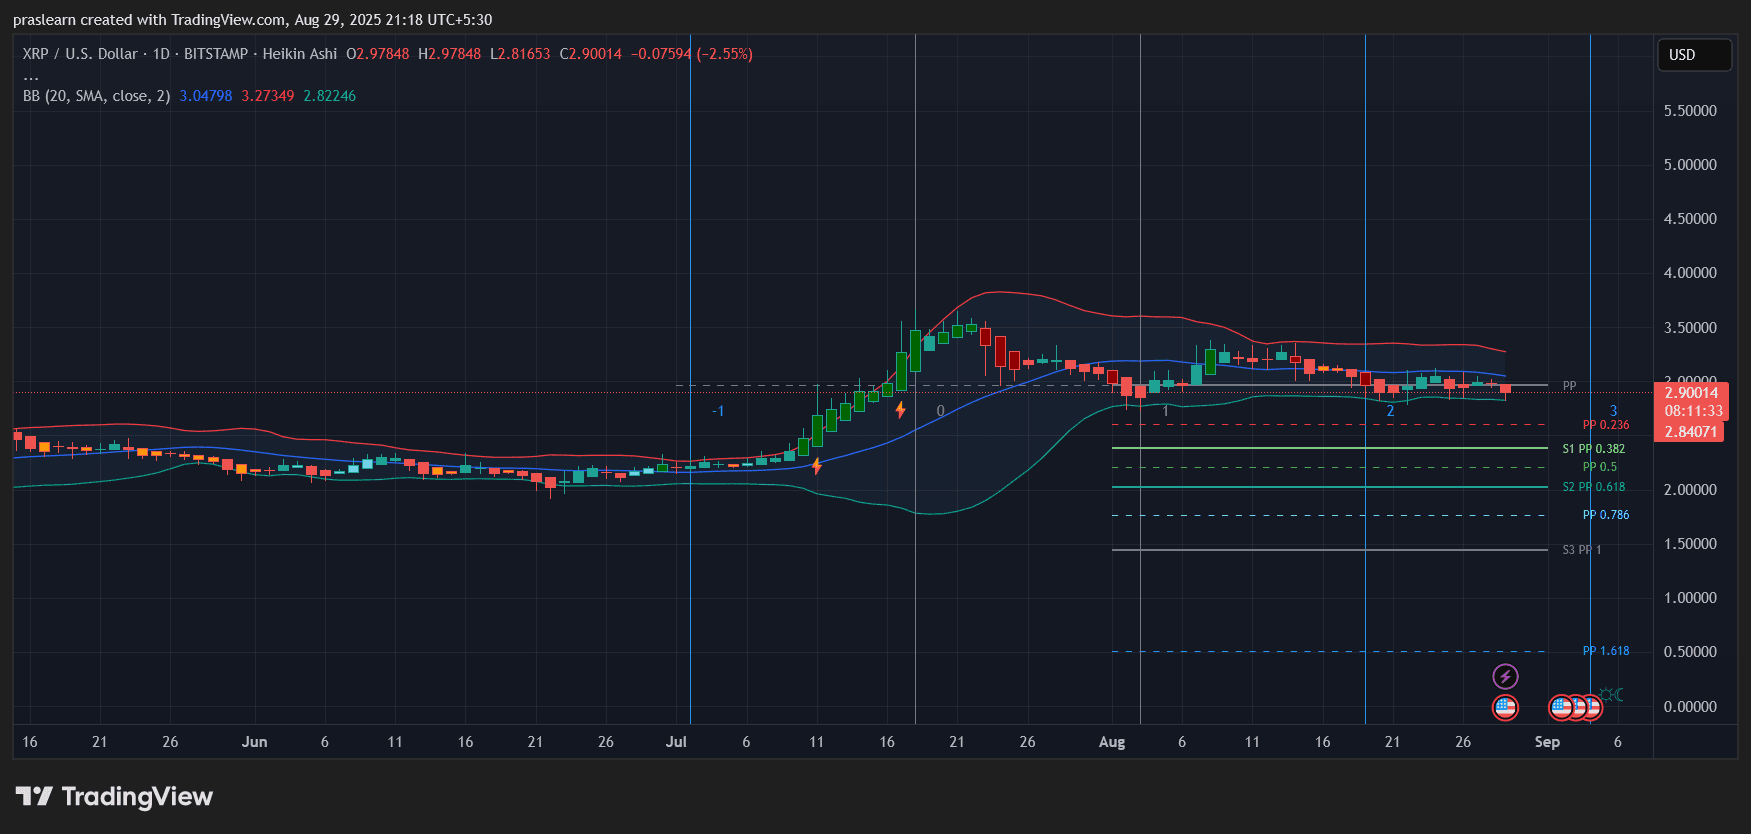
 XRP/USD Daily Chart- TradingView
Looking at the daily chart, XRP price is sitting just above $2.84 support, which coincides with the 0.236 Fibonacci retracement zone. The Bollinger Bands are contracting, signaling reduced volatility, but price is hugging the lower band—a bearish continuation setup.
Key levels to watch:
- Immediate support: $2.83–2.84 (current zone). A break here opens the door to $2.70 (0.382 Fibonacci).
- Stronger support: $2.35–2.40 (0.5 retracement). A deeper flush could test $2.10 (0.618 retracement).
- Resistance: $3.05 and $3.30. Bulls need to reclaim these levels to shift momentum.
Momentum indicators are showing weakness, and with sellers in control, downside risks outweigh upside potential for now.
XRP Price Prediction: What’s Next?
In the short term, XRP price looks vulnerable to a further slide toward $2.70 , especially if ETF uncertainty drags on and macroeconomic jitters remain unresolved. If that level breaks, a deeper correction to $2.35 is likely before buyers step back in.
On the flip side, if Fed policy turns more dovish in September and ETF sentiment stabilizes, $XRP could attempt to reclaim $3.05. Only a decisive close above $3.30 would revive hopes for a return to the $3.70 range flagged by Martinez earlier.
XRP price is at a crossroads. The technical chart shows weakness, and the fundamental backdrop—regulatory uncertainty, ETF hesitation, and global trade tensions—adds to the pressure. Until $XRP reclaims $3.05 with strong volume, the path of least resistance remains down, with $2.70 as the next key magnet for price action.
Disclaimer: The content of this article solely reflects the author's opinion and does not represent the platform in any capacity. This article is not intended to serve as a reference for making investment decisions.
You may also like
Decoding VitaDAO: A Paradigm Revolution in Decentralized Science

Mars Morning News | ETH returns to $3,000, extreme fear sentiment has passed
The Federal Reserve's Beige Book shows little change in U.S. economic activity, with increasing divergence in the consumer market. JPMorgan predicts a Fed rate cut in December. Nasdaq has applied to increase the position limit for BlackRock's Bitcoin ETF options. ETH has returned to $3,000, signaling a recovery in market sentiment. Hyperliquid has sparked controversy due to a token symbol change. Binance faces a $1 billion terrorism-related lawsuit. Securitize has received EU approval to operate a tokenization trading system. The Tether CEO responded to S&P's credit rating downgrade. Large Bitcoin holders are increasing deposits to exchanges. Summary generated by Mars AI. The accuracy and completeness of this summary are still being iteratively improved by the Mars AI model.

The central bank sets a major tone on stablecoins for the first time—where will the market go next?
The People's Bank of China held a meeting to crack down on virtual currency trading and speculation, clearly defining stablecoins as a form of virtual currency with risks of illegal financial activities, and emphasized the continued prohibition of all virtual currency-related businesses.

