Bitget App
Trade smarter
Buy cryptoMarketsTradeFuturesEarnWeb3SquareMore
Trade
Spot
Buy and sell crypto with ease
Margin
Amplify your capital and maximize fund efficiency
Onchain
Going Onchain, without going Onchain!
Convert
Zero fees, no slippage
Explore
Launchhub
Gain the edge early and start winning
Copy
Copy elite trader with one click
Bots
Simple, fast, and reliable AI trading bot
Trade
USDT-M Futures
Futures settled in USDT
USDC-M Futures
Futures settled in USDC
Coin-M Futures
Futures settled in cryptocurrencies
Explore
Futures guide
A beginner-to-advanced journey in futures trading
Futures promotions
Generous rewards await
Overview
A variety of products to grow your assets
Simple Earn
Deposit and withdraw anytime to earn flexible returns with zero risk
On-chain Earn
Earn profits daily without risking principal
Structured Earn
Robust financial innovation to navigate market swings
VIP and Wealth Management
Premium services for smart wealth management
Loans
Flexible borrowing with high fund security
Shiba Inu May See Daily Golden or Death Cross After Hourly Golden Cross Amid Fed-Driven Buying

Shiba Inu May See Daily Golden or Death Cross After Hourly Golden Cross Amid Fed-Driven Buying

CoinotagCoinotag2025/08/24 12:55
By:Marisol Navaro

  • Hourly golden cross confirmed: short-term SMA crossed above long-term SMA, prompting strong intraday buying.

  • Shiba Inu peaked at $0.0000135 on renewed Fed dovish hopes, then retraced amid profit-taking.

  • Daily SMA50 and SMA200 are converging; a death cross or golden cross on the daily chart will shape medium-term bias.

Shiba Inu golden cross signals short-term bullish momentum after an hourly SMA crossover; read COINOTAG analysis of levels, risks, and next steps for traders.


What is the Shiba Inu golden cross on the hourly chart?

Shiba Inu golden cross on the hourly chart is when a short-term moving average crosses above a longer-term moving average, indicating rising short-term momentum. The hourly SMA crossover produced immediate buying pressure and a spike to $0.0000135, signaling potential continuation if supported by volume.

The hourly golden cross came as market participants digested dovish commentary from Fed Chair Jerome Powell at the Jackson Hole symposium and rising odds of a September rate cut. Short-term traders responded quickly, buying dips into the crossover.
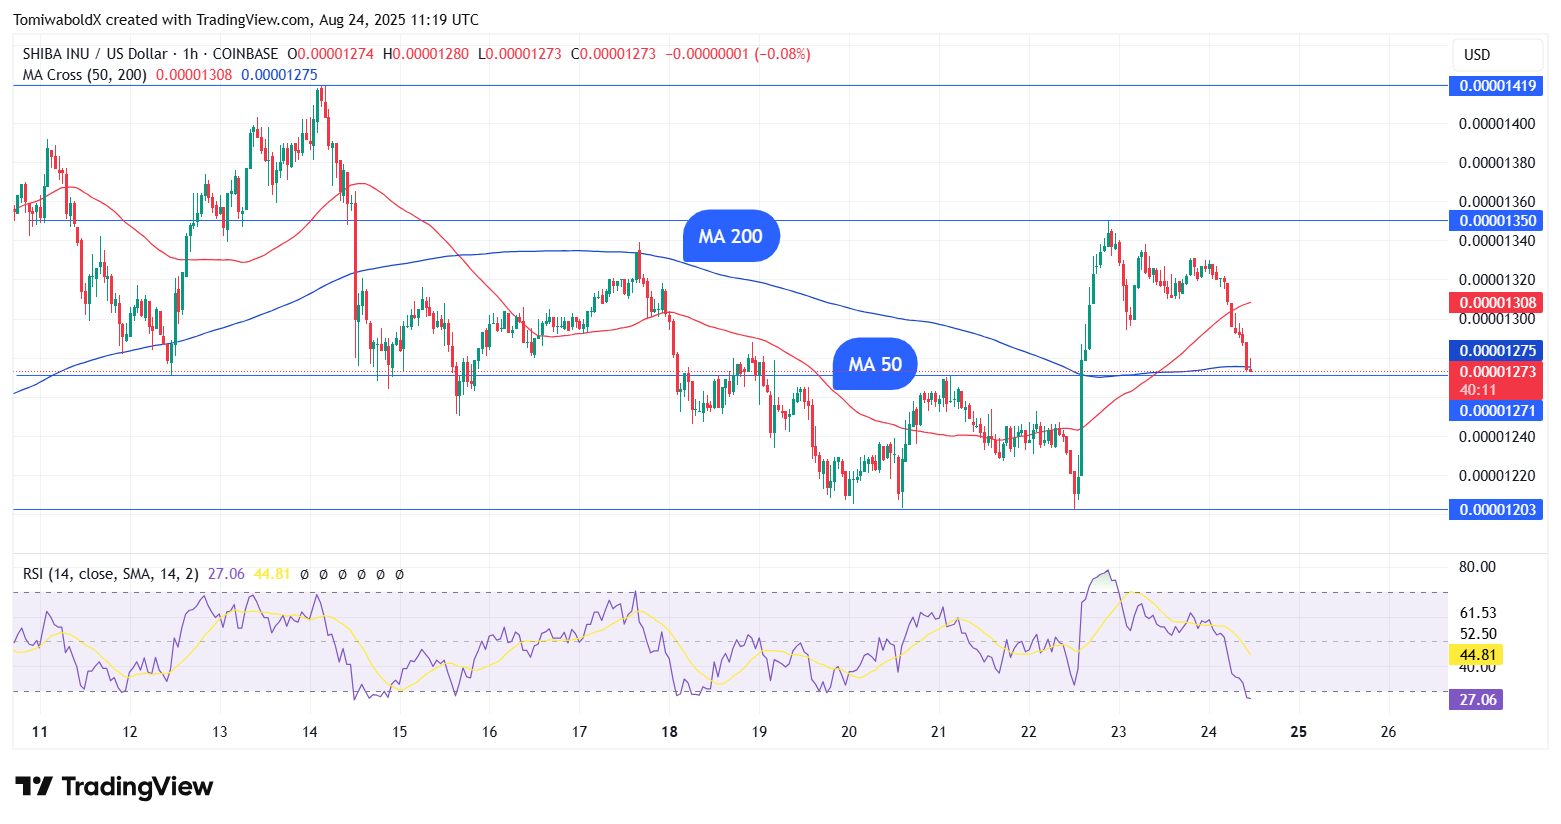
Shiba Inu May See Daily Golden or Death Cross After Hourly Golden Cross Amid Fed-Driven Buying image 0
SHIB/USD Hourly Chart, Courtesy: TradingView

How did macro commentary influence the SHIB move?

Fed dovishness lowered short-term yields and boosted risk appetite, which supported altcoin demand, including SHIB. Traders reacted to higher perceived probability of a September rate cut by buying into short-term momentum plays.

Volume confirmed the initial move but profit-taking followed, producing a 3.2% intraday decline to $0.00001276 and a 3% weekly drop as traders locked gains.

Is Shiba Inu on the verge of a major daily crossover?

The daily SMA50 and SMA200 are converging and could produce either a golden cross or a death cross in the coming days. This convergence is notable because daily crossovers carry greater weight for medium-term market structure than hourly signals.

If a death cross forms, it would be the second daily death cross this year (the prior occurred in February 2025), which preceded a decline to roughly $0.00001. Conversely, the last daily golden cross in November 2024 preceded a run to $0.00003344 in subsequent weeks.

How should traders interpret these crossover scenarios?

  • Hourly golden cross: Short-term bullish, use as a trigger for intraday or swing trades with tight stops.
  • Daily crossover: Determines medium-term bias—golden cross favors bulls, death cross favors bears.
  • Risk management: Watch volume, on-chain metrics, and macro headlines; set stop-losses below recent swing lows.


Frequently Asked Questions

What price levels should traders watch for Shiba Inu?

Watch $0.0000135 as the recent intraday peak and $0.0000120–$0.0000115 as short-term support. A sustained break below the daily SMA50 would increase downside risk toward $0.00001.

How likely is a daily golden cross versus a death cross?

Both outcomes are possible as the daily moving averages are flattened and converging. Probability depends on near-term price direction and macro catalysts; monitor daily closes for confirmation.

Key Takeaways

  • Hourly golden cross confirmed: Intraday bullish momentum pushed SHIB to $0.0000135 before profit-taking.
  • Daily crossover imminent: SMA50 and SMA200 convergence could produce a decisive medium-term signal.
  • Manage risk: Confirm with volume and macro cues, and use disciplined stop-losses to protect capital.

Conclusion

The Shiba Inu hourly golden cross indicates short-term bullish momentum, while the approaching daily SMA convergence will determine medium-term direction. Traders should combine crossover signals with volume, on-chain metrics, and macro updates to form a data-driven plan. COINOTAG will monitor developments and update the analysis as new data appears.

In Case You Missed It: Allianz Report Suggests Bitcoin Could Be a Credible Store of Value, Signaling Institutional Acceptance
0

Disclaimer: The content of this article solely reflects the author's opinion and does not represent the platform in any capacity. This article is not intended to serve as a reference for making investment decisions.

PoolX: Earn new token airdrops
Lock your assets and earn 10%+ APR
Lock now!

You may also like

Ethereum News Today: Mystery 2000 ETH Deposit to Lido Sparks Staking Strategy Speculation

- 2000 ETH was withdrawn from a CEX at $4,445/ETH and deposited into Lido’s Community Staking Module (CSM) within one hour. - On-chain analyst Ai Auntie flagged the 0x832…07F84 address activity, highlighting Lido’s growing role in Ethereum’s post-merge staking ecosystem. - Lido’s CSM v2 update raises community staking limits to 5%, while its ICS program prioritizes verified stakers with higher rewards and lower bonds. - The unverified deposit underscores strategic interest in staking over speculation, alig

ainvest2025/08/31 02:18
Ethereum News Today: Mystery 2000 ETH Deposit to Lido Sparks Staking Strategy Speculation

The Strategic Implications of Legal Clarity for Bitcoin Treasury Firms

- August 2025 dismissal of Strategy Inc. class-action lawsuit marks legal clarity for Bitcoin treasury strategies, boosting institutional confidence in crypto-backed equities. - Investors voluntarily dropped claims with prejudice, establishing corporate crypto accounting under ASU 2023-08 as legally defensible despite $4.22B losses. - Regulatory developments like SEC's Project Crypto and CLARITY Act align with Strategy case, signaling maturing frameworks for digital asset oversight and market efficiency. -

ainvest2025/08/31 02:15
The Strategic Implications of Legal Clarity for Bitcoin Treasury Firms

BONK +53.52% in 24 Hours Amid Volatile Price Swings

- BONK surged 53.52% in 24 hours to $0.00002096, reversing a prolonged downturn amid volatile swings. - The token gained 627.06% weekly but remains 1363.98% below its one-month level and 2629.17% lower annually. - Analysts highlight continued volatility due to speculative trading and market sentiment sensitivity. - Technical indicators show early divergence in RSI/MACD, with EMAs flattening as traders watch for equilibrium signals.

ainvest2025/08/31 02:03
BONK +53.52% in 24 Hours Amid Volatile Price Swings

Chainlink's Strategic Breakout Potential: Is $31 the Gateway to a Multi-Stage Bull Run?

- Chainlink (LINK) faces critical $31 resistance in late 2025, with technical patterns suggesting potential breakout to $47–$219. - Institutional adoption surges via U.S. Commerce Department partnership, whale activity, and $2.8M token buybacks boosting liquidity. - Historical backtesting warns 30-day resistance tests often trigger 6.5% average declines, highlighting mean reversion risks. - Symmetrical triangle pattern and Elliott Wave III imply $52–$98 targets if $31 is breached, but $21–$22 retracement o

ainvest2025/08/31 02:00
Chainlink's Strategic Breakout Potential: Is $31 the Gateway to a Multi-Stage Bull Run?