Bitcoin is retesting the $108,000 neckline after a breakout; BTC trades near $112,888 with strong liquidity and $38M in 24‑hour liquidations. Holding $108K would keep a bullish target near $144,105 intact, while a decisive break could open the door to a deeper correction.
-
Bitcoin retests $108K neckline; holding it keeps bullish target near $144K intact.
-
BTC trades at $112,888 with $32.67B 24h volume and robust market participation.
-
Derivatives show $38.09M liquidations; longs dominate but higher lows since April 2025 suggest buyer strength.
Meta description: Bitcoin retests $108K neckline as BTC trades near $112,888; watch support for a potential move to $144,105. Read analysis and key takeaways.
What is the current Bitcoin price and market snapshot?
Bitcoin is trading near $112,888, with 24‑hour volume of $32.67 billion and market cap around $2.247 trillion, according to on‑chain and exchange metrics. Price ranged between $112,023 and $113,827 over the prior 24 hours, showing limited intraday variance.
How significant is the $108,000 neckline retest?
The $108,000 neckline is a key technical level from an inverse head and shoulders formed between December 2024 and June 2025. A successful retest that holds as support validates the breakout and keeps a target near $144,105 on the table. Losing the neckline would increase the probability of a deeper correction.
Bitcoin retests $108K neckline after breakout as analysts watch support, with $112,888 price, $32.67B volume, and $38M liquidations.
- Bitcoin retests $108K neckline; holding it keeps bullish target near $144K intact.
- Coingecko shows BTC at $112,888 with $32.67B volume, strong liquidity, steady activity.
- Coinglass notes $38M liquidations; longs dominate, but higher lows sustain a bullish trend.
Bitcoin is trading near an important level after forming an inverse head and shoulders structure on the weekly chart. The neckline, positioned around $108,000, was broken earlier in 2025 when the price advanced to nearly $120,000. The market is now retesting this neckline, and its ability to hold as support is being closely watched.
How should traders interpret the neckline retest?
Traders should front‑load monitoring on weekly closes and volume. A weekly close comfortably above $108,000 with sustained volume supports continuation toward the technical projection. Conversely, a failure to hold could trigger stop‑hunts and a move to lower support zones.
What do on‑chain and derivatives metrics show?
Exchange metrics indicate circulating supply near 19,909,815 BTC and a market capitalization around $2.247 trillion. Derivatives platforms report $69.87B trading volume (down 9.89%) and open interest at $81.17B, while options volume increased 26.95% to $5.79B. Liquidations reached $38.09M in 24 hours, skewed toward longs.
Technical overlays such as Fibonacci retracements align with the neckline region, adding confluence to the support hypothesis. Since April 2025, higher lows have formed, reinforcing a bullish bias provided the neckline stands.
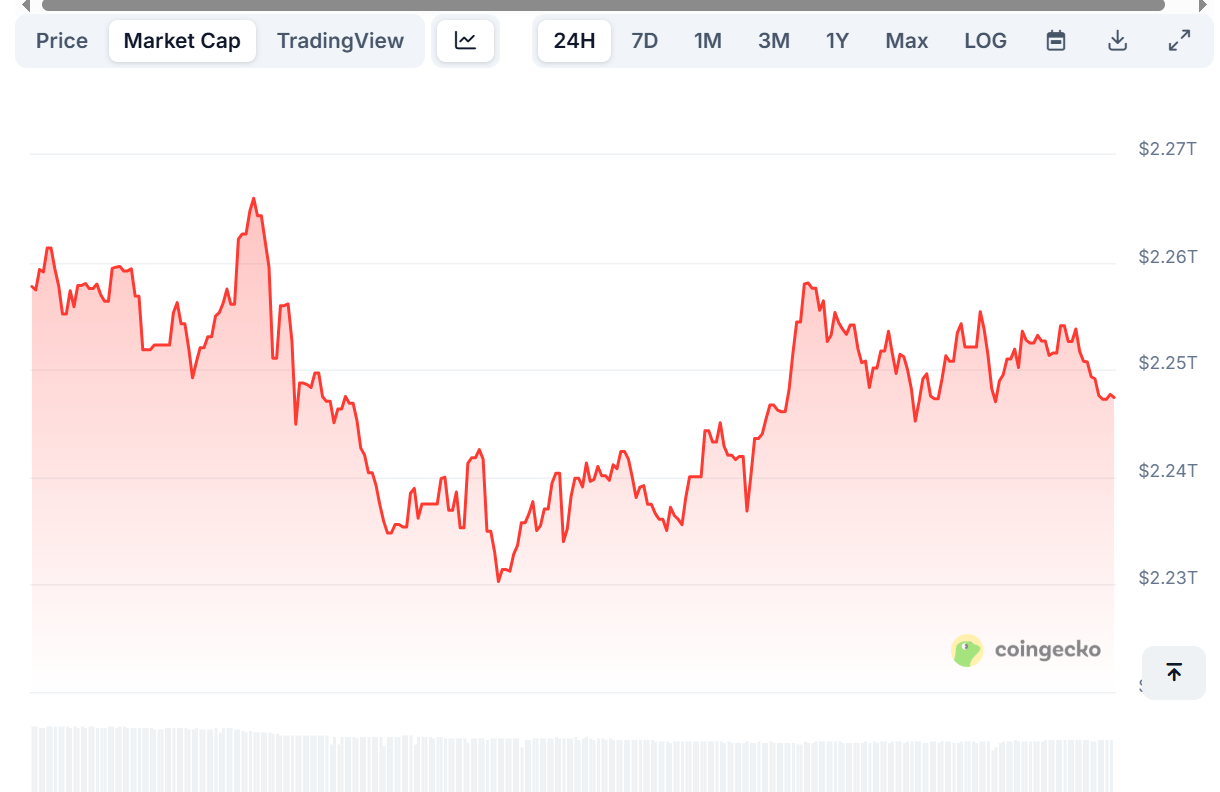
Source: Coingecko
Market liquidity remains robust with 24‑hour traded value above $32 billion. This volume profile supports meaningful price discovery while derivatives flows indicate active hedging and speculative positioning.
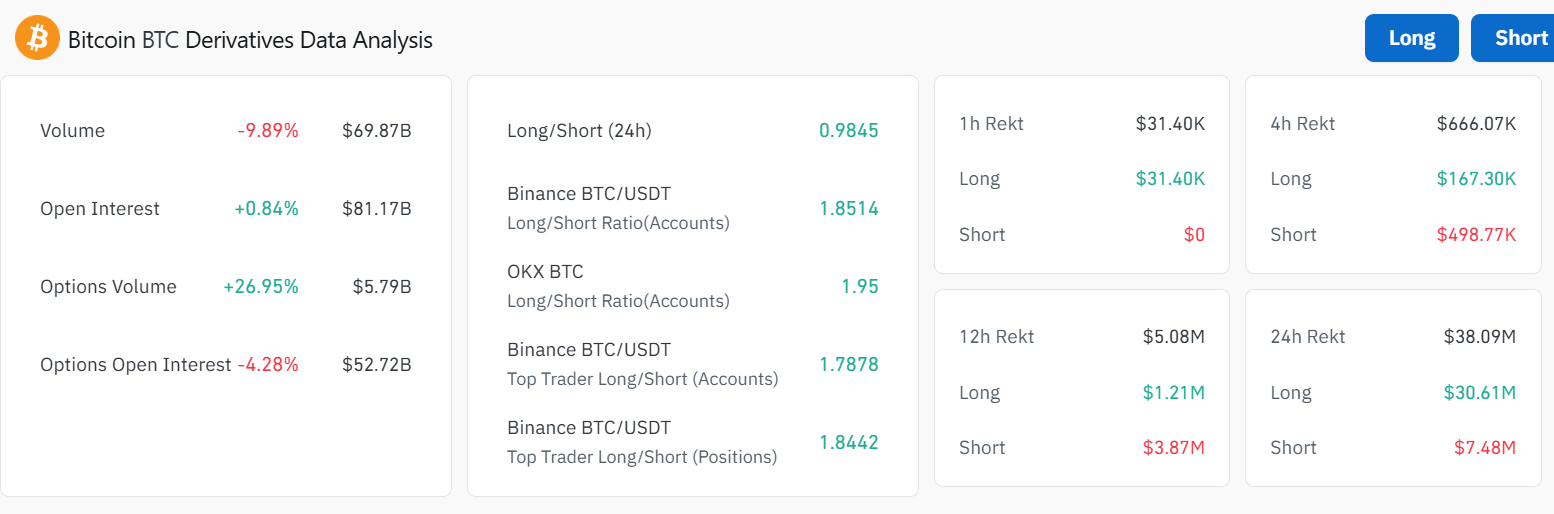
Source: Coinglass
Derivatives detail mixed signals: while total futures volume eased near 9.9%, open interest climbed to $81.17 billion, and options showed higher traded volume but slightly lower open interest. These metrics suggest active repositioning ahead of the neckline outcome.
When will the market decide the next major move?
The decisive timeframe is the coming weekly candle(s). A confirmed weekly close above the neckline with supportive volume favors the bullish projection toward $144,105. A breach and sustained trading below $108,000 would increase downside risk and may invalidate the pattern’s upside projection.
Frequently Asked Questions
What happens if Bitcoin loses the $108K neckline?
If Bitcoin loses the $108K neckline, expect increased downside pressure and potential re‑test of lower support zones. Stops under the neckline could accelerate selling and trigger further liquidations, especially among leveraged long positions.
Is $144,105 a realistic target for BTC?
The $144,105 level is the technical projection from the inverse head and shoulders pattern. It is realistic if the neckline holds and market participation remains strong, but traders should manage risk and monitor volume confirmation.
How do liquidations affect price momentum?
Liquidations remove leveraged positions and can create rapid price moves. The recent $38.09M in 24‑hour liquidations—mostly longs—suggests short‑term volatility, but persistent higher lows point to underlying buyer interest.
Key Takeaways
- Neckline test: $108,000 is the critical support level to watch for validating the breakout.
- Market snapshot: BTC at $112,888, $32.67B 24h volume, $38.09M liquidations—liquidity supports price action.
- Trading plan: Favor bullish continuation if weekly closes above the neckline; set protective risk limits if $108K is decisively lost.
Conclusion
Bitcoin’s retest of the $108K neckline is the central event dictating near‑term direction. Front‑loaded metrics—price, volume, open interest and liquidations—paint a mixed but monitorable picture. COINOTAG will continue to track on‑chain and derivatives data; traders should watch weekly closes and manage risk as the market decides the next leg.