Bitget App
Trade smarter
Buy cryptoMarketsTradeFuturesEarnWeb3SquareMore
Trade
Spot
Buy and sell crypto with ease
Margin
Amplify your capital and maximize fund efficiency
Onchain
Going Onchain, without going Onchain!
Convert
Zero fees, no slippage
Explore
Launchhub
Gain the edge early and start winning
Copy
Copy elite trader with one click
Bots
Simple, fast, and reliable AI trading bot
Trade
USDT-M Futures
Futures settled in USDT
USDC-M Futures
Futures settled in USDC
Coin-M Futures
Futures settled in cryptocurrencies
Explore
Futures guide
A beginner-to-advanced journey in futures trading
Futures promotions
Generous rewards await
Overview
A variety of products to grow your assets
Simple Earn
Deposit and withdraw anytime to earn flexible returns with zero risk
On-chain Earn
Earn profits daily without risking principal
Structured Earn
Robust financial innovation to navigate market swings
VIP and Wealth Management
Premium services for smart wealth management
Loans
Flexible borrowing with high fund security
Ethereum’s Early August Surge Meets Reality Check as Bears Eye Dip Below $4,000

Ethereum’s Early August Surge Meets Reality Check as Bears Eye Dip Below $4,000

BeInCryptoBeInCrypto2025/08/21 08:30
By:Abiodun Oladokun

After Ethereum's early August surge to $4,793, sell-offs and profit-taking have created significant pressure, leaving ETH vulnerable to a dip below $4,000. With weak sentiment among derivatives traders, bears are eyeing a drop to $3,491.

Ethereum’s rally in early August drove the largest altcoin to a cycle peak of $4,793 by August 14, marking one of its strongest performances of the year. 

However, the sharp rise also triggered a wave of profit-taking, which has since put significant pressure on the asset and caused it to lose much of its recent gains. With selloffs intensifying in the derivatives market, ETH now faces the risk of a breakdown below the $4,000 price mark.

ETH Faces Heavy Sell Pressure 

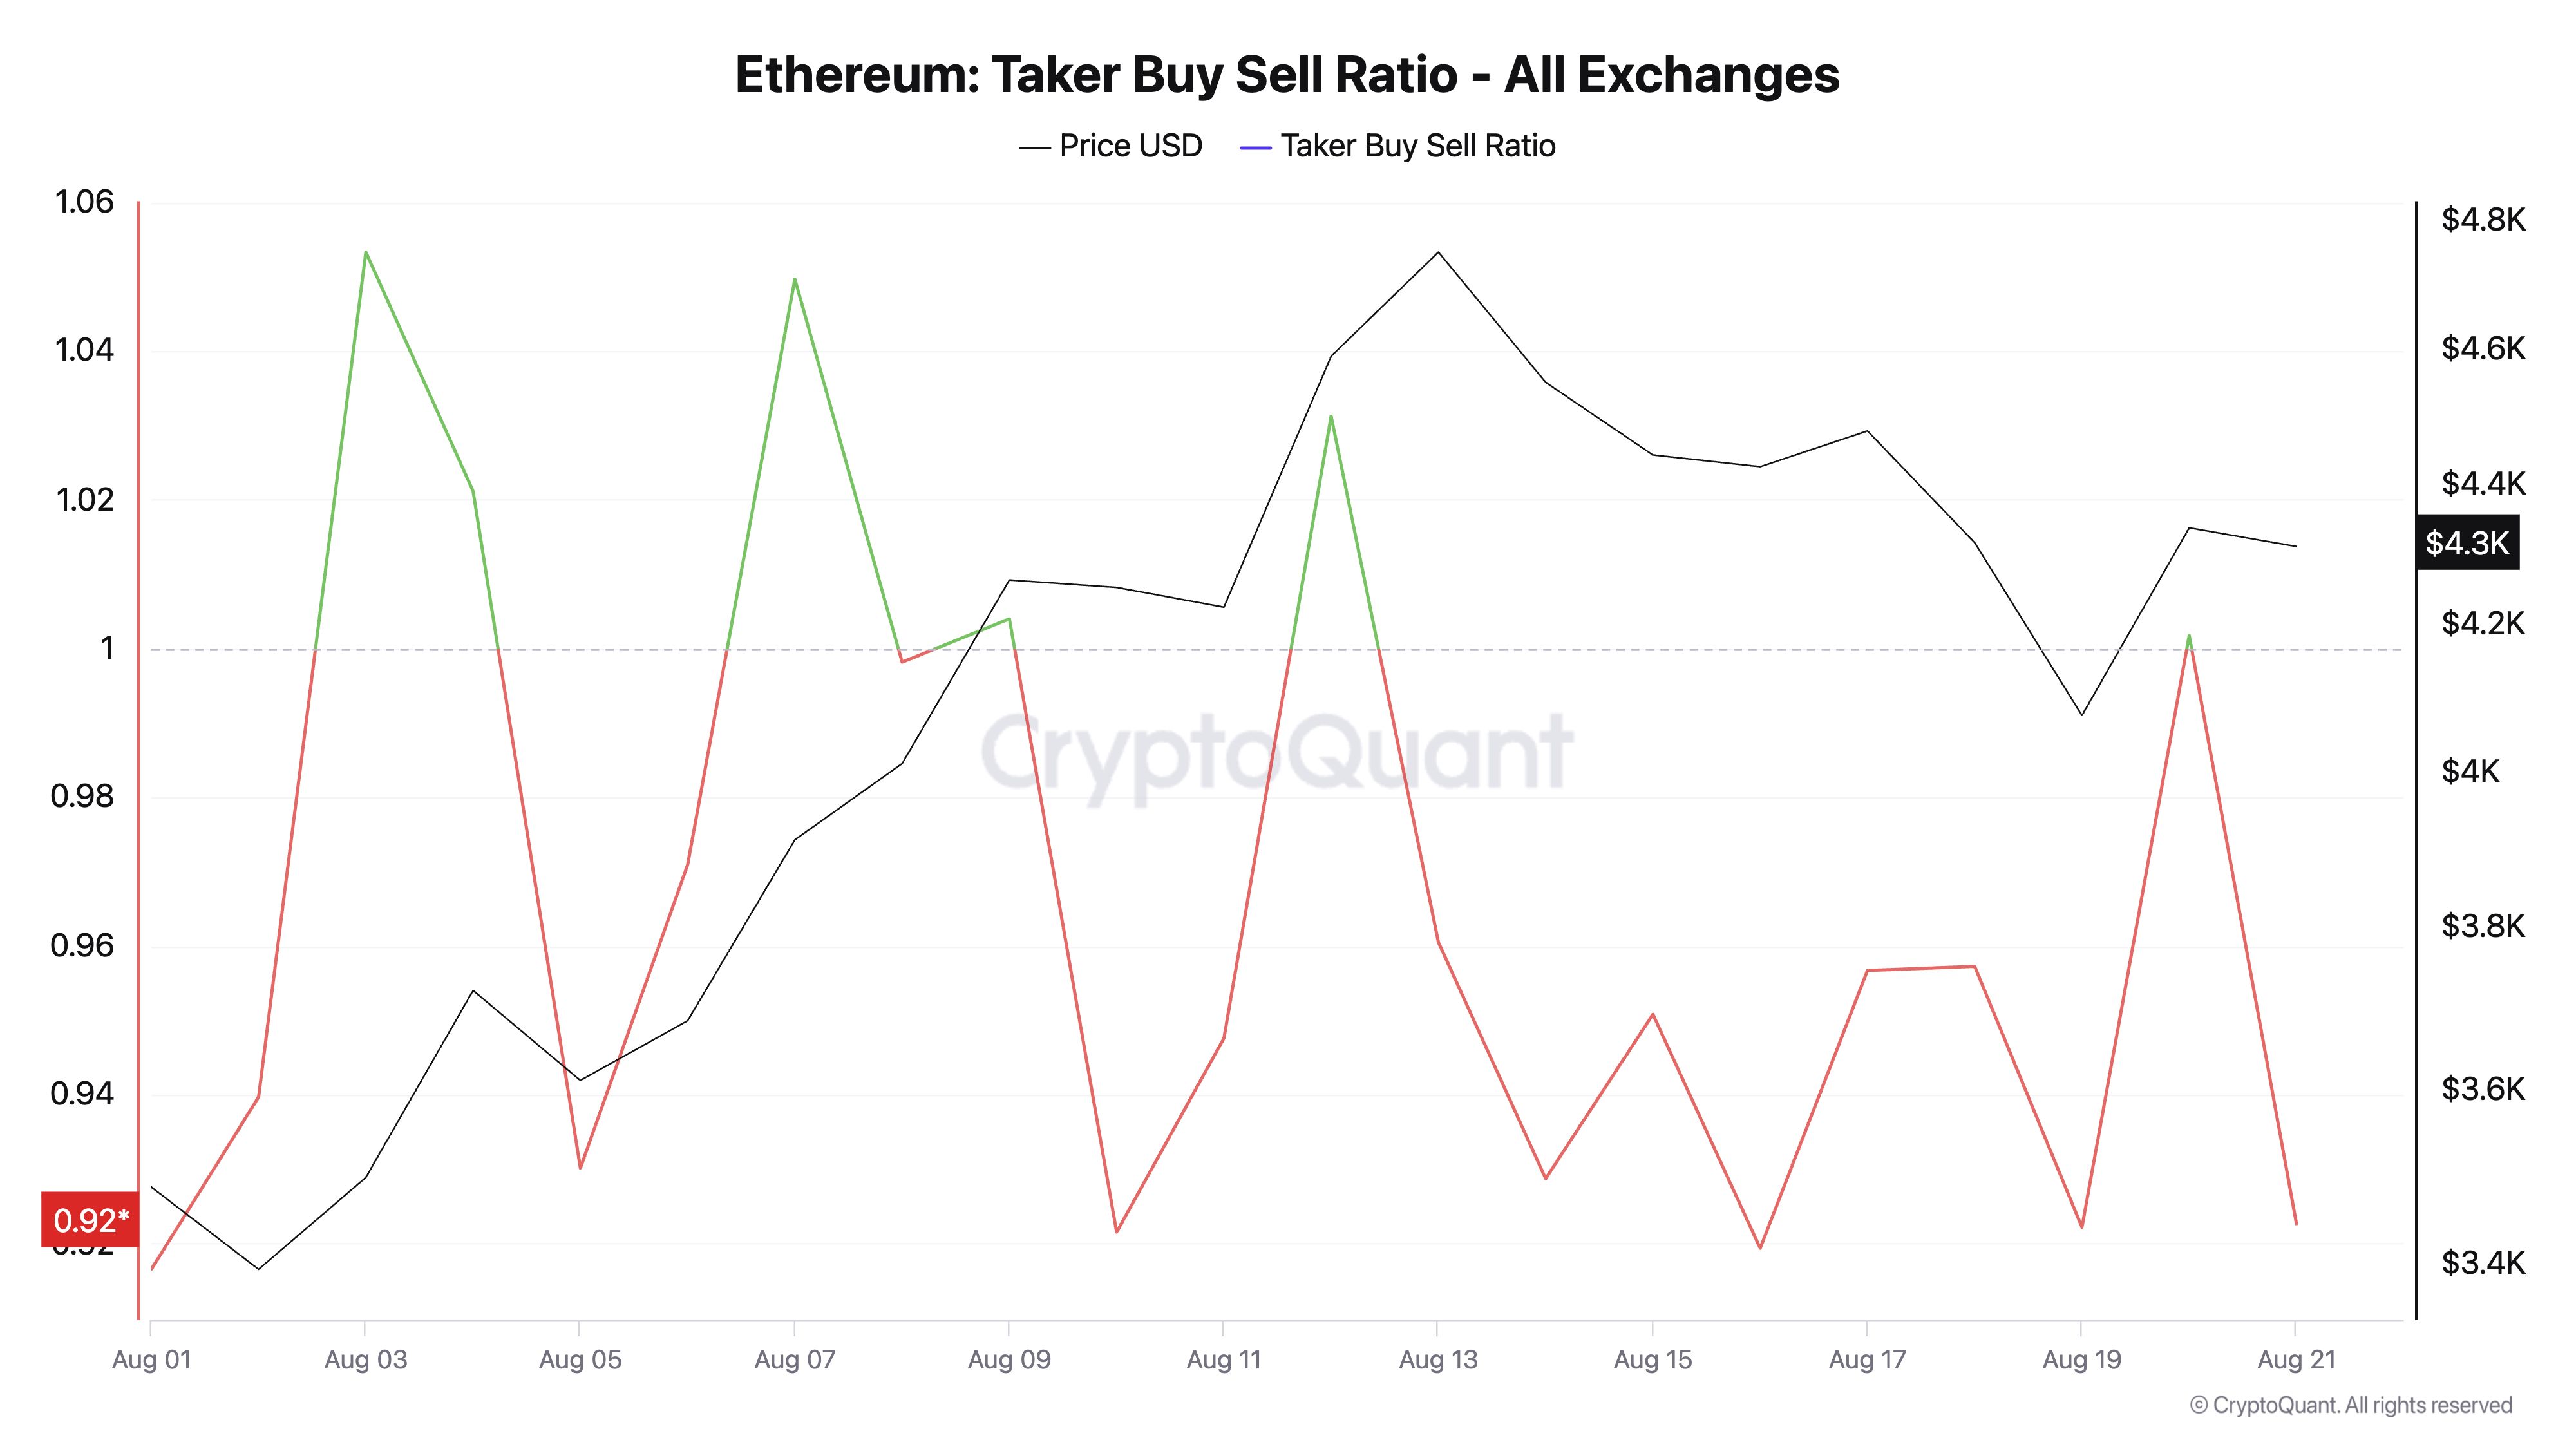
ETH’s price has been weighed down by the bearish tilt in sentiment among its derivatives traders. This is reflected by its taker-buy/sell ratio, which has mostly remained under one since the beginning of August. 

At press time, this stands at 0.92 per CryptoQuant, indicating that sell orders dominate buy orders across the ETH futures market. 
Ethereum’s Early August Surge Meets Reality Check as Bears Eye Dip Below $4,000 image 0ETH Taker Buy Sell Ratio. Source: CryptoQuant

The taker buy-sell ratio measures the balance between buy and sell orders in an asset’s futures market. A ratio above one indicates stronger buying pressure, showing traders are actively chasing price gains. On the other hand, a value below one reflects dominant selling pressure, often linked to profit-taking or bearish sentiment.

Since August began, ETH’s taker buy/sell ratio has stayed mostly below one, confirming persistent sell-offs among futures traders. 

For context, the coin’s performance had been largely muted for much of the year, so when an uptrend finally began in July and extended into early August, many traders seized the opportunity to lock in profits.

This mounting sell-side pressure confirms the weakening bullish sentiment and could worsen ETH’s price fall if it continues.

Traders Ditch High-Risk Bets Amid Price Pressure

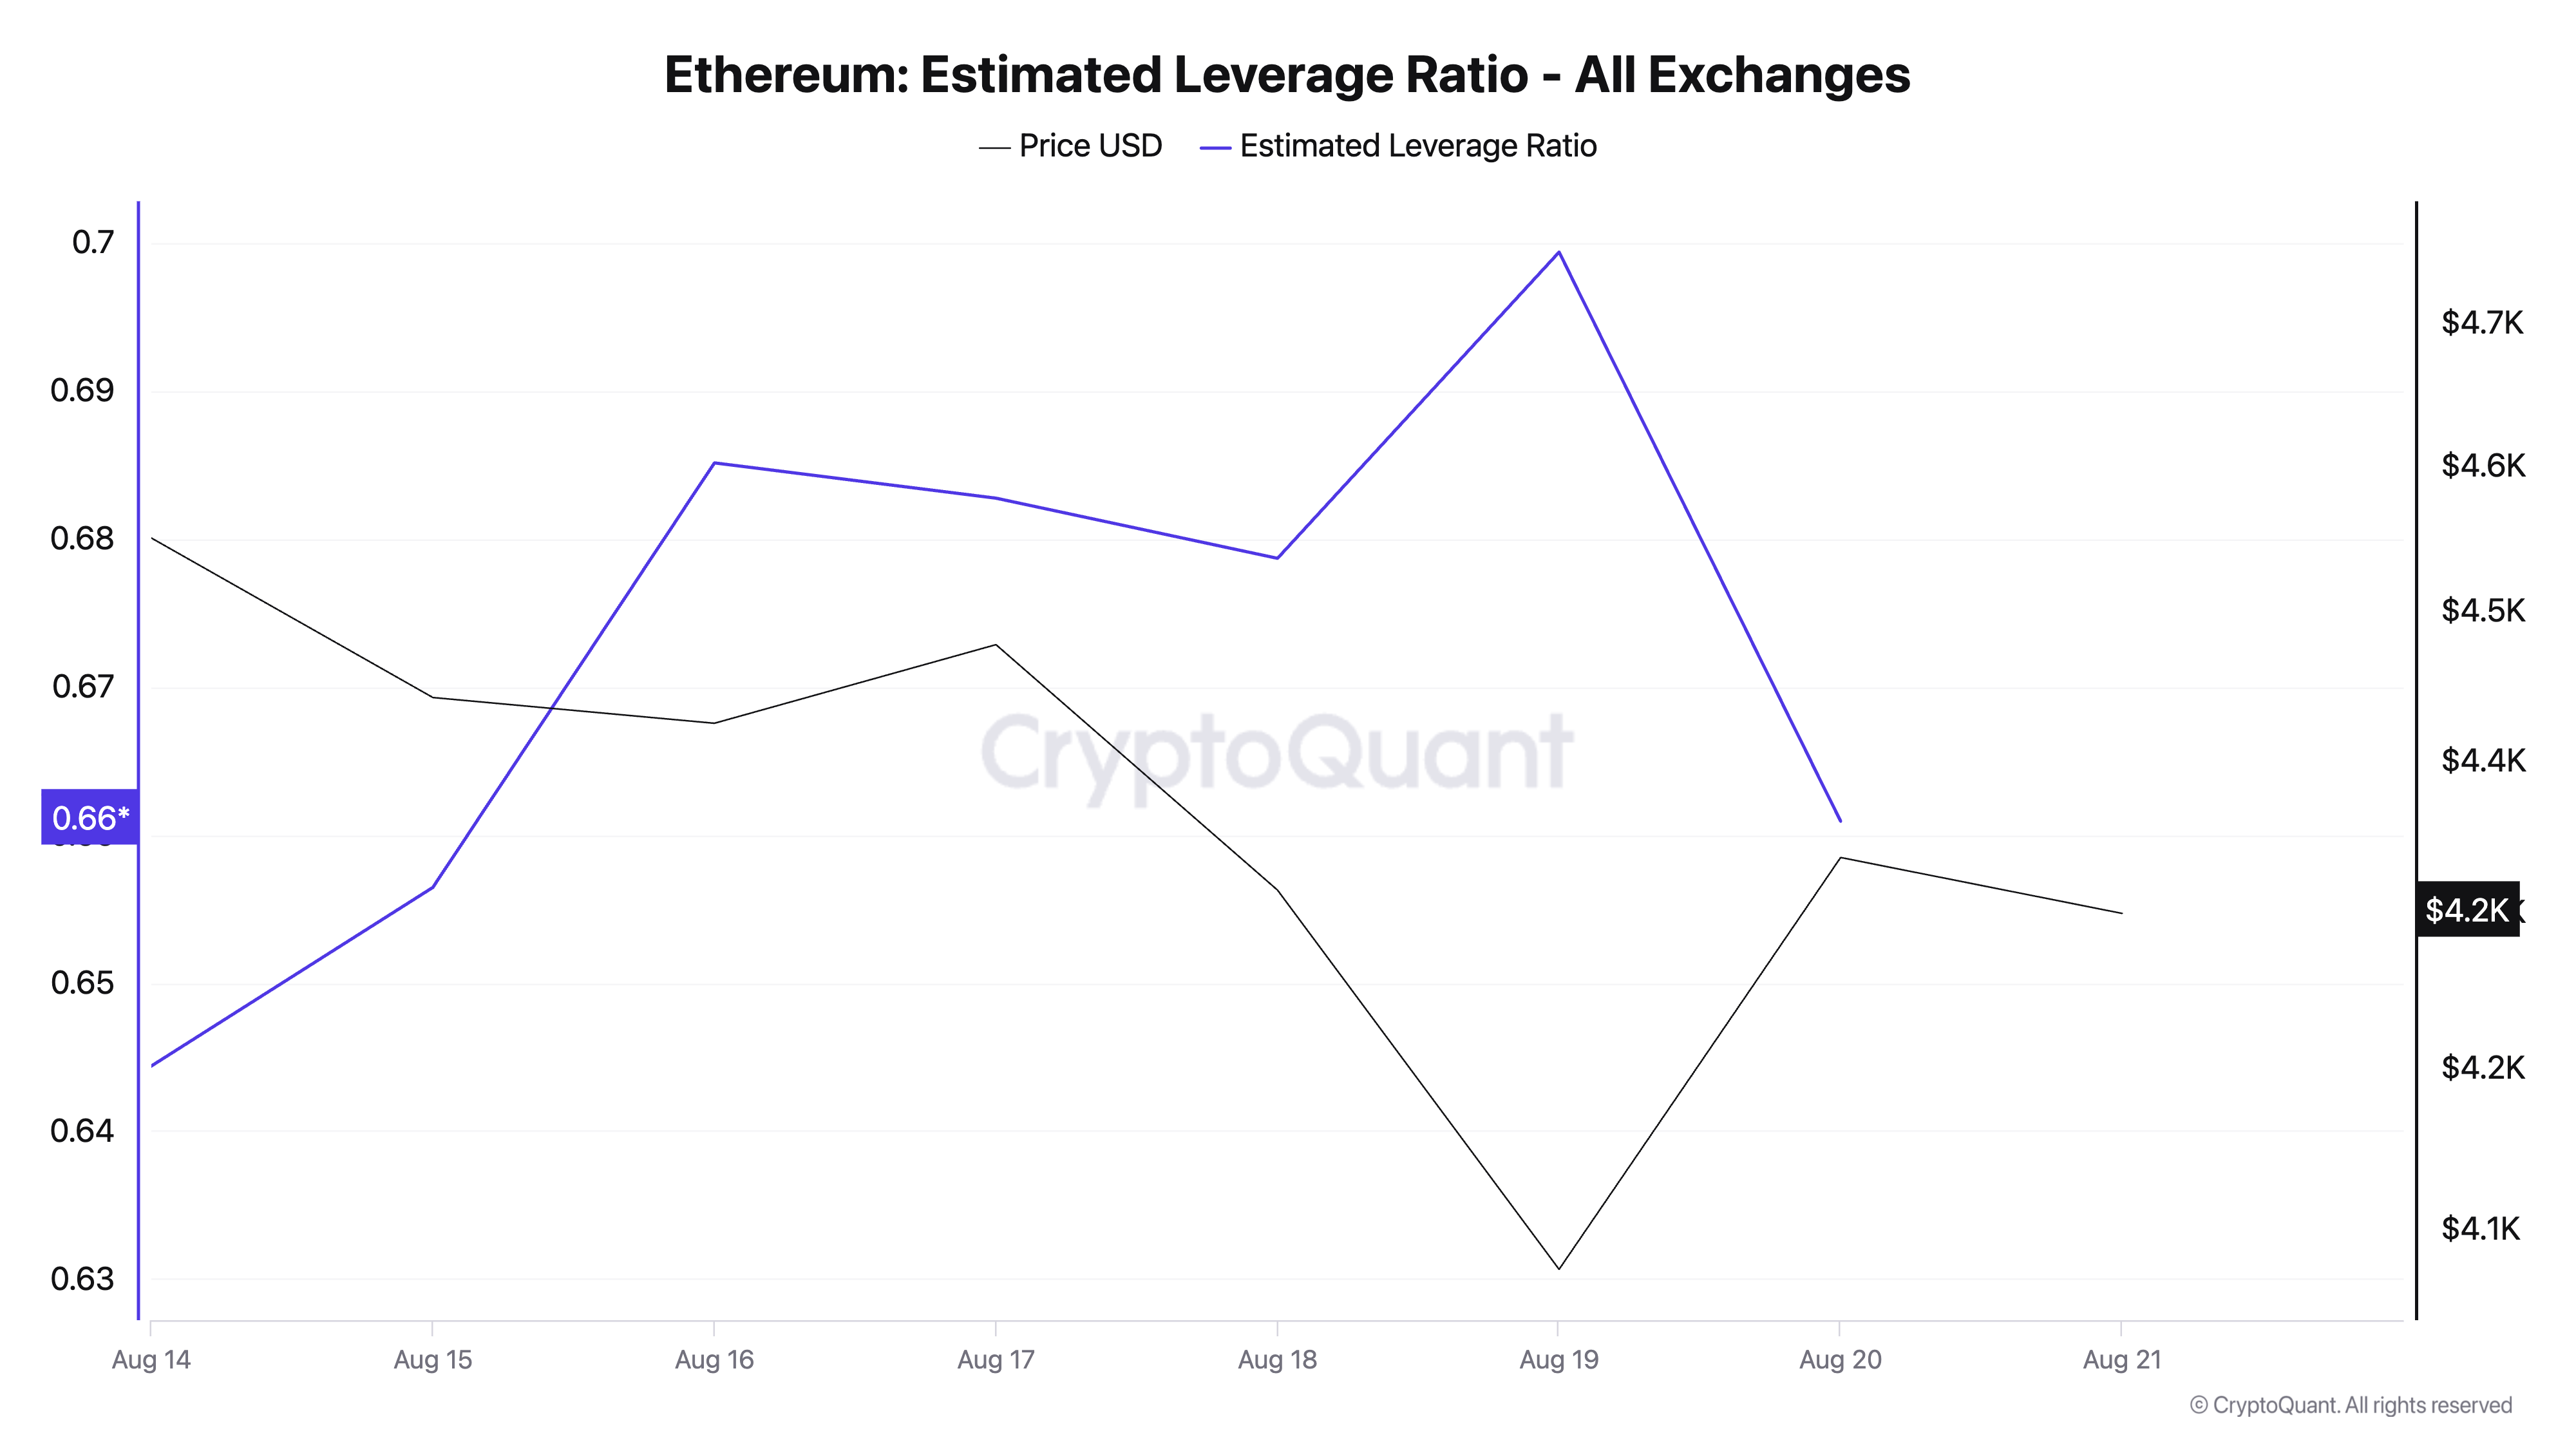
The recent decline in ETH’s Estimated Leverage Ratio (ELR) also confirms the low confidence among coin holders. According to CryptoQuant, ETH’s ELR currently sits at 0.66 — its lowest value in the past five days.
Ethereum’s Early August Surge Meets Reality Check as Bears Eye Dip Below $4,000 image 1ETH Estimated Leverage. Source: CryptoQuant

An asset’s ELR measures the average leverage its traders use to execute trades on a cryptocurrency exchange. It is calculated by dividing the asset’s open interest by the exchange’s reserve for that currency. 

When an asset’s ELR falls, it indicates a reduced risk appetite among traders. This trend signals that ETH  investors have grown increasingly cautious this week and are now avoiding high-leverage positions that could worsen potential losses.

Which Comes First: $3,491 or $4,793?

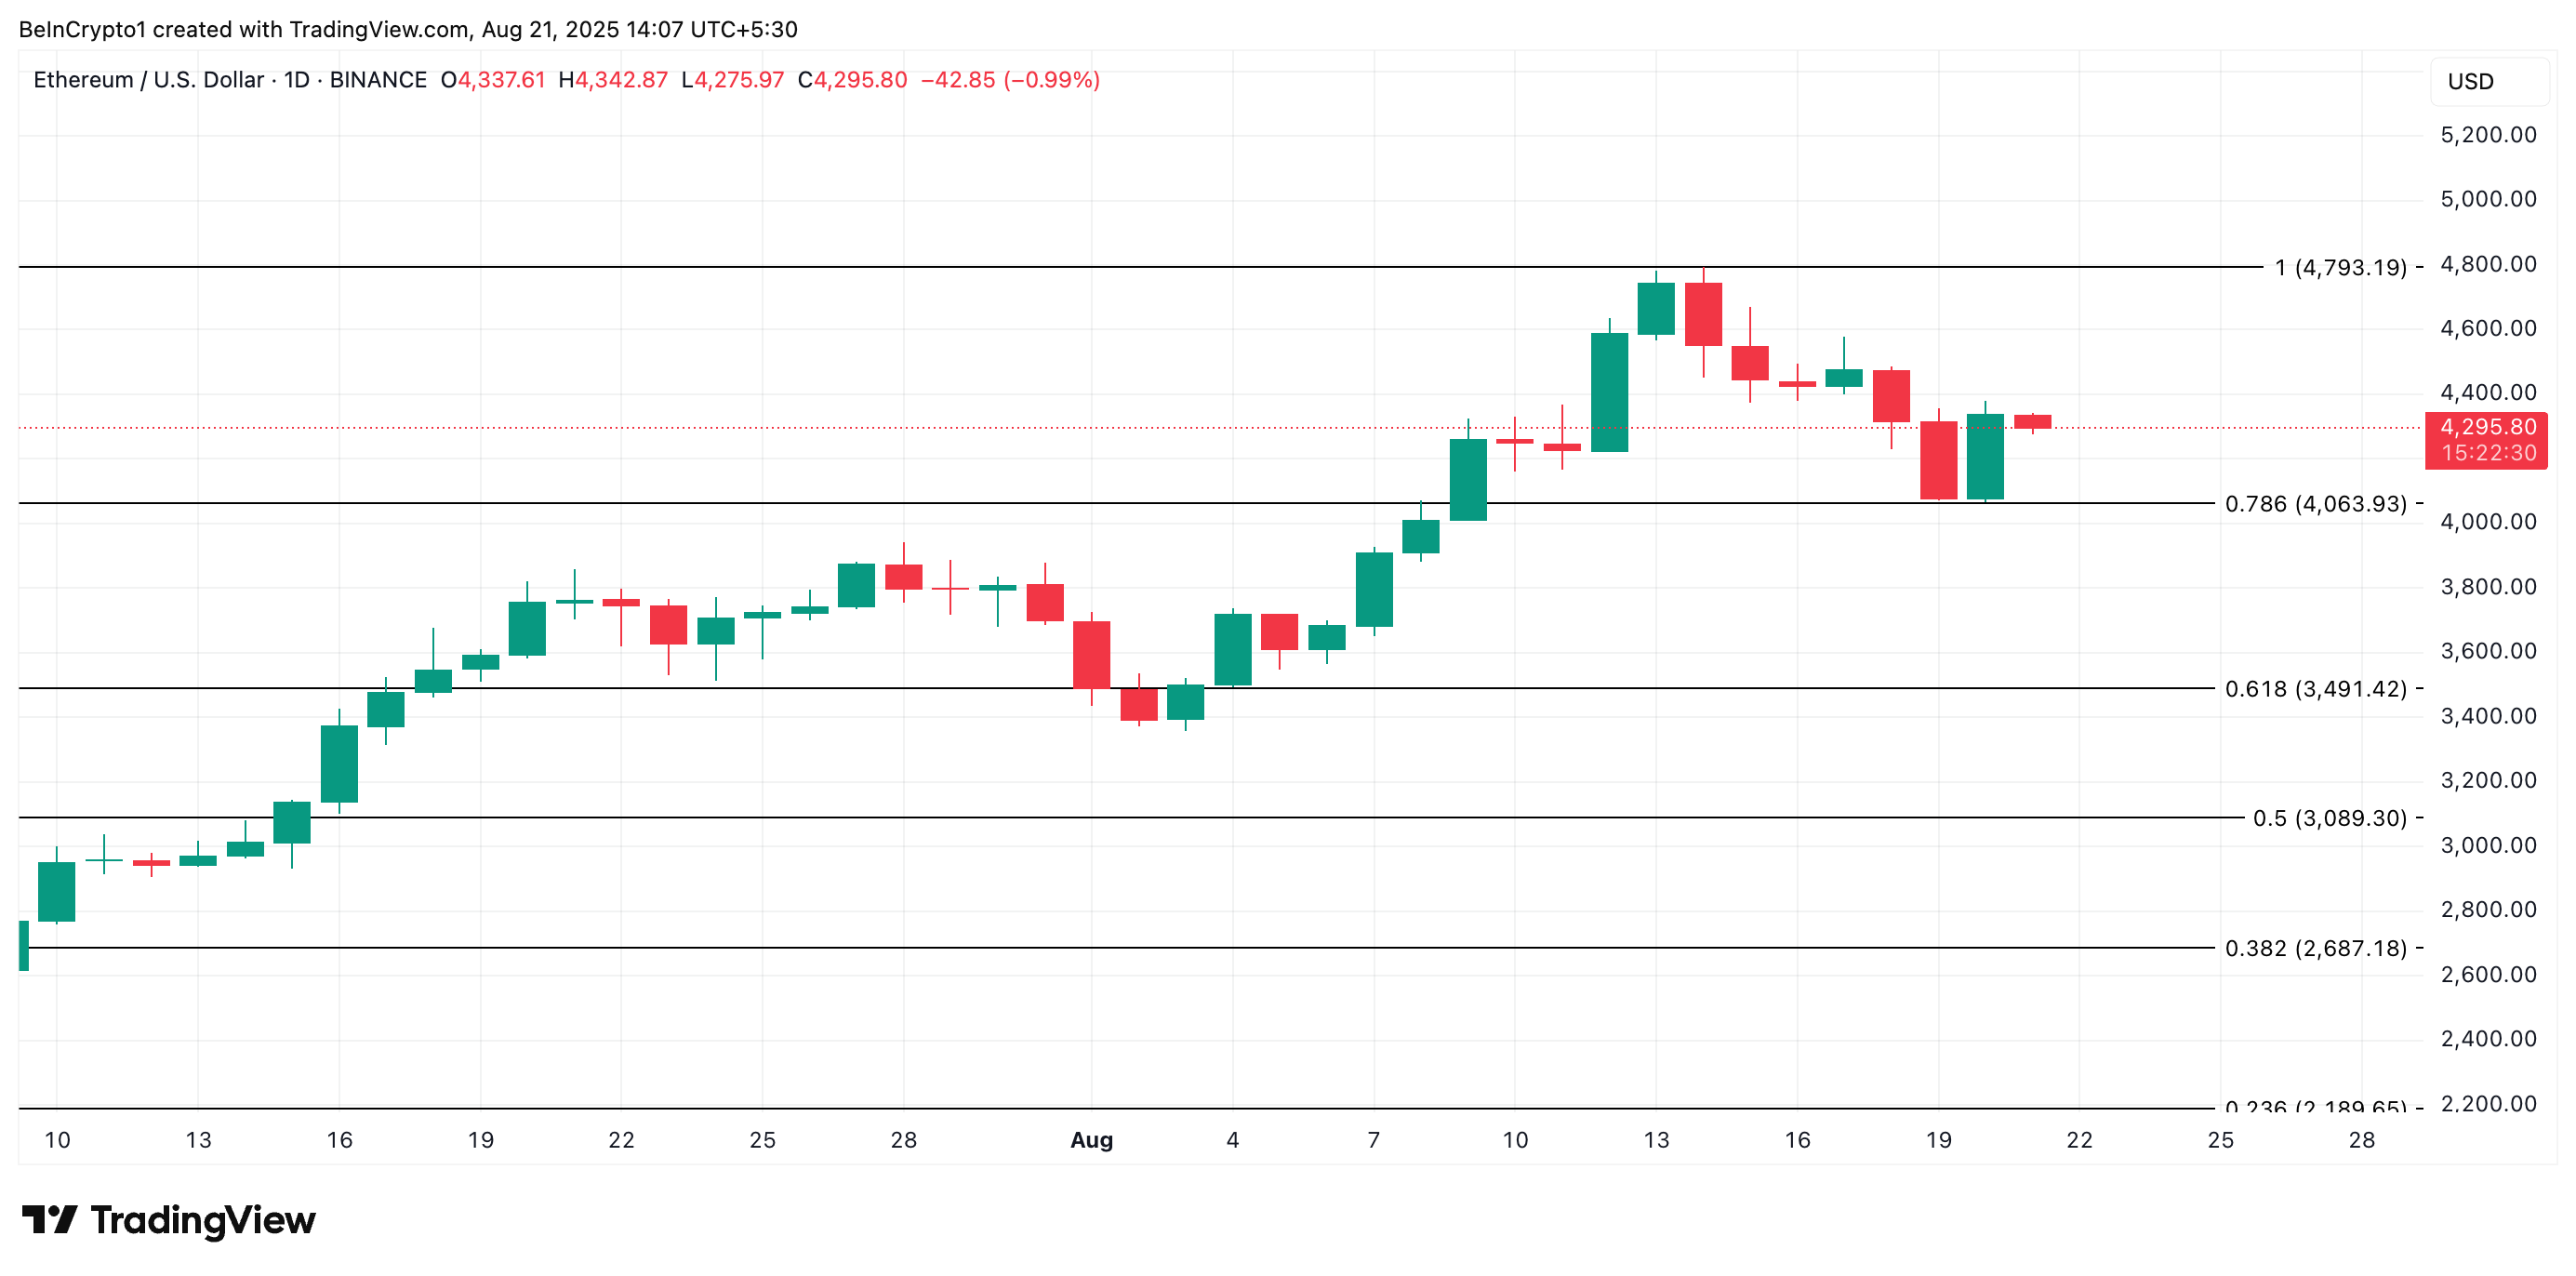
As of this writing, ETH trades at $4,295. If sell-side pressure strengthens, the altcoin could retest the support floor at $4,063. Should this key price mark give way, ETH could plunge to $3,491.
Ethereum’s Early August Surge Meets Reality Check as Bears Eye Dip Below $4,000 image 2ETH Price Analysis. Source: TradingView

Conversely, ETH could see a rebound and rally to $4,793 if new demand enters the market.

0

Disclaimer: The content of this article solely reflects the author's opinion and does not represent the platform in any capacity. This article is not intended to serve as a reference for making investment decisions.

PoolX: Earn new token airdrops
Lock your assets and earn 10%+ APR
Lock now!

You may also like

Quantum-Resistant Crypto Asset Allocation: Lessons from El Salvador's Bitcoin Strategy

- Quantum computing threatens RSA/ECDSA encryption, prompting urgent adoption of NIST's post-quantum standards like CRYSTALS-Dilithium and SPHINCS+. - El Salvador's Bitcoin strategy splits $678M reserves into 14 wallets with quantum-resistant SPHINCS+ signatures to mitigate ECDSA vulnerabilities. - Institutional investors are implementing hybrid cryptographic systems and regulatory frameworks (e.g., PSAD licenses) to balance legacy infrastructure with quantum resilience. - Proactive fragmentation and real-

ainvest2025/08/31 10:30
Quantum-Resistant Crypto Asset Allocation: Lessons from El Salvador's Bitcoin Strategy

Thiel’s Calculated Caution vs. Saylor’s Bitcoin All-In: A Clash of Crypto Treasury Philosophies

- Peter Thiel advocates diversified crypto and traditional asset portfolios, emphasizing long-term capital preservation through strategic tax vehicles and high-impact investments. - Michael Saylor's $76B Bitcoin-only corporate treasury model leverages debt financing for aggressive growth, but risks margin calls if prices fall below net asset value. - Macroeconomic shifts toward Bitcoin as a hedge against fiat devaluation have accelerated adoption, with 180 companies now holding BTC amid 4-5% inflation and

ainvest2025/08/31 10:30
Thiel’s Calculated Caution vs. Saylor’s Bitcoin All-In: A Clash of Crypto Treasury Philosophies

Avalanche's Critical $16 Support Level: A Tactical Buy Opportunity Amid Market Volatility

- Avalanche (AVAX) trades near $23.50–$24.00, with $16 support level critical for bearish/bullish outcomes. - Technical indicators show $26.50 resistance failing, risking decline to $16 if $22.19 support breaks. - Risk strategies suggest long positions near $23.70 with $20.50 stop-loss or $16 rebound entries. - Institutional interest in AVAX, including potential Grayscale ETF approval, could stabilize price at $16. - $16 level represents key inflection point balancing technical analysis, capital flows, and

ainvest2025/08/31 10:30
Avalanche's Critical $16 Support Level: A Tactical Buy Opportunity Amid Market Volatility

"LINK's Momentum Wanes as Profit-Selling Looms"

- Chainlink (LINK) faces potential correction after 115% annual gains, with 87.4% of tokens in profit and technical indicators showing weakening momentum. - Negative Chaikin Money Flow and an ascending wedge pattern signal fading bullish pressure, testing critical $22.84 support level. - Whale accumulation and U.S. Commerce Department partnership with Chainlink highlight renewed institutional interest despite exchange outflows. - Market consolidation between $21-$27 is likely, with $27.88 breakout needed t

ainvest2025/08/31 10:18
"LINK's Momentum Wanes as Profit-Selling Looms"