- Bitcoin repeats cycle of failed breakouts, liquidity sweeps, and sharp reversals.
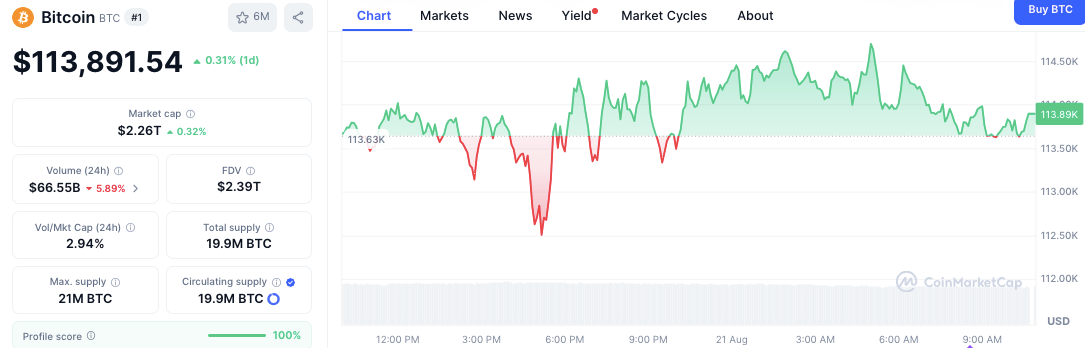
- BTC trades near $113,900 with $2.26T market cap and $66.55B daily volume.
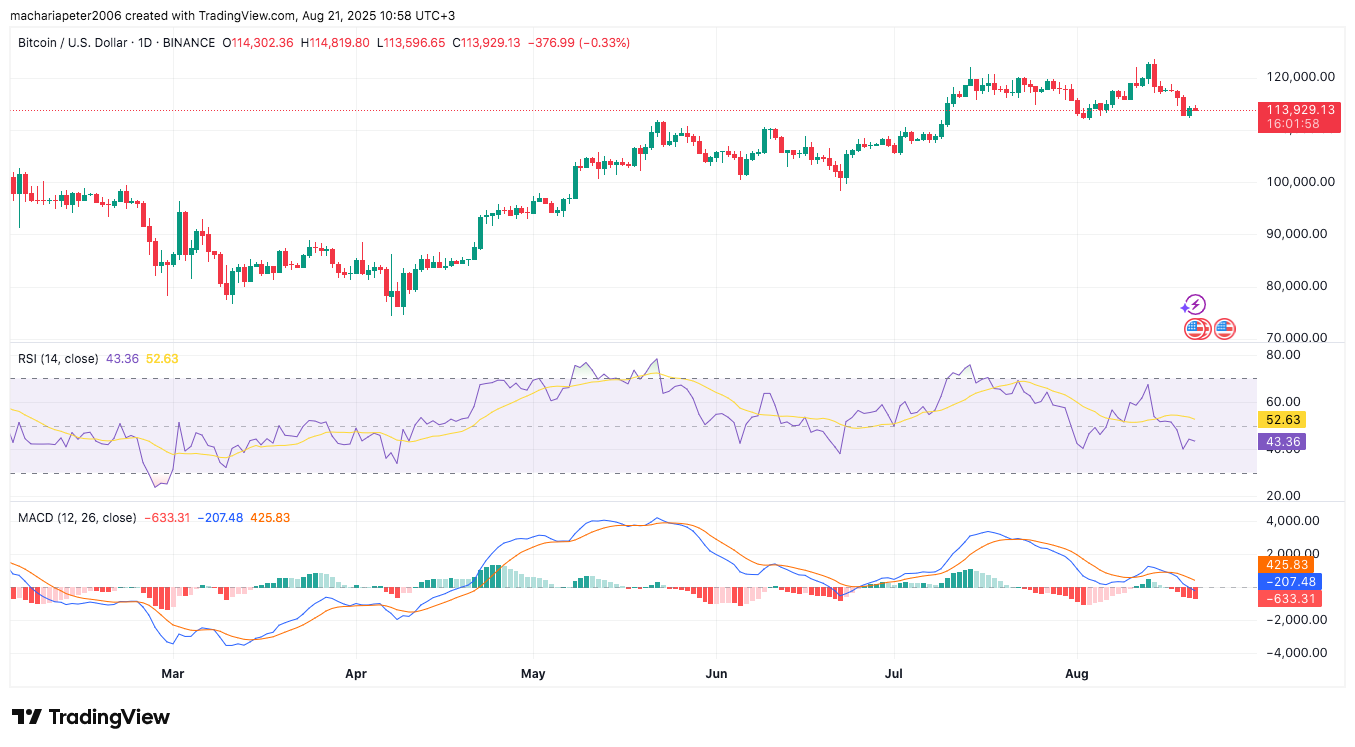
- RSI at 43.36 and negative MACD signal short-term bearish momentum.
Bitcoin is once again tracing a familiar price structure that has defined multiple market cycles, according to a new analysis shared by Crypto Rover. The current consolidation, marked by a series of failed breakout attempts, is part of a recurring pattern of liquidity shifts that has historically dictated Bitcoin’s broader trend.
Is Bitcoin Following a Historical Script?
The multi-year chart presented by Crypto Rover outlines a repeating cycle of consolidation phases, failed breakouts, and sharp liquidity shifts. The green circles on the chart highlight attempts to break resistance that quickly reverse, while red circles show dips below support that are aggressively bought up.
This exact behavior was seen in 2023 and 2024, where these deviations from the range ultimately preceded strong rallies to new highs. Now, in 2025, the same pattern is re-emerging. If this historical structure continues to play out, the analyst’s projection indicates Bitcoin could eventually test the $120,000 to $140,000 range in the coming years.
Related: Bitcoin Price Analysis: Key Targets to Consider Amid High-Impact News
What Do BTC’s Short-Term Indicators Say?
While the long-term map looks familiar, the immediate technical indicators are flashing caution. The Relative Strength Index (RSI) is at 43.36, down from 52.63, showing weakening buying strength. An RSI closer to 30 would suggest oversold conditions.
 Source: TradingView
The Moving Average Convergence Divergence (MACD) affirms this situation. The MACD line is at -207.48 against a signal line of 425.83, producing a negative histogram reading of -633.31. Expanding red bars on the histogram indicate selling pressure may continue.
Bitcoin’s Current Price Battle
As of press time, Bitcoin was trading at $113,891.54, up 0.31% in the past day. Its market capitalization is $2.26 trillion, while the fully diluted valuation (FDV) stands at $2.39 trillion. The 24-hour trading volume declined 5.89% to $66.55 billion, leaving the volume-to-market cap ratio at 2.94%. Circulating supply is near 19.9 million BTC, approaching the hard cap of 21 million.
 Source: CoinMarketCap
Intraday movements have shown volatility, with lows near $113,600 and quick rebounds above $114,000. Resistance is identified slightly above $114,500, while support remains firm around $113,000.
This tight range reflects the consolidation highlighted in the long-term pattern, as traders wait for a decisive catalyst, detailed in our latest report: Bitcoin Price Dips to $115K as Traders Await Fed Chair Powell’s Jackson Hole Speech .