Bitget App
Trade smarter
Buy cryptoMarketsTradeFuturesEarnWeb3SquareMore
Trade
Spot
Buy and sell crypto with ease
Margin
Amplify your capital and maximize fund efficiency
Onchain
Going Onchain, without going Onchain!
Convert
Zero fees, no slippage
Explore
Launchhub
Gain the edge early and start winning
Copy
Copy elite trader with one click
Bots
Simple, fast, and reliable AI trading bot
Trade
USDT-M Futures
Futures settled in USDT
USDC-M Futures
Futures settled in USDC
Coin-M Futures
Futures settled in cryptocurrencies
Explore
Futures guide
A beginner-to-advanced journey in futures trading
Futures promotions
Generous rewards await
Overview
A variety of products to grow your assets
Simple Earn
Deposit and withdraw anytime to earn flexible returns with zero risk
On-chain Earn
Earn profits daily without risking principal
Structured Earn
Robust financial innovation to navigate market swings
VIP and Wealth Management
Premium services for smart wealth management
Loans
Flexible borrowing with high fund security
Pepe (PEPE) Dips To Test Key Support – What Could Come Next?

Pepe (PEPE) Dips To Test Key Support – What Could Come Next?

CoinsProbeCoinsProbe2025/08/18 20:55
By:Nilesh Hembade

Date: Mon, Aug 18, 2025 | 07:54 AM GMT

The cryptocurrency market is under slight selling pressure as Ethereum (ETH) drops 4% on the day, sliding to $4,250 from its recent high of $4,780. This decline has spilled over into memecoins , with Pepe (PEPE) among the notable decliners.

PEPE fell more than 5% today and is down 10% on the week, bringing the token to a critical support zone that could shape its next move.

Pepe (PEPE) Dips To Test Key Support – What Could Come Next? image 0 Source: Coinmarketcap

Testing Key Support

On the daily chart, PEPE appears to be consolidating within a symmetrical triangle pattern — typically a precursor to a strong breakout in either direction. The latest pullback has driven price toward the triangle’s lower boundary, near $0.00001060, where buyers are now being tested.

Pepe (PEPE) Dips To Test Key Support – What Could Come Next? image 1 
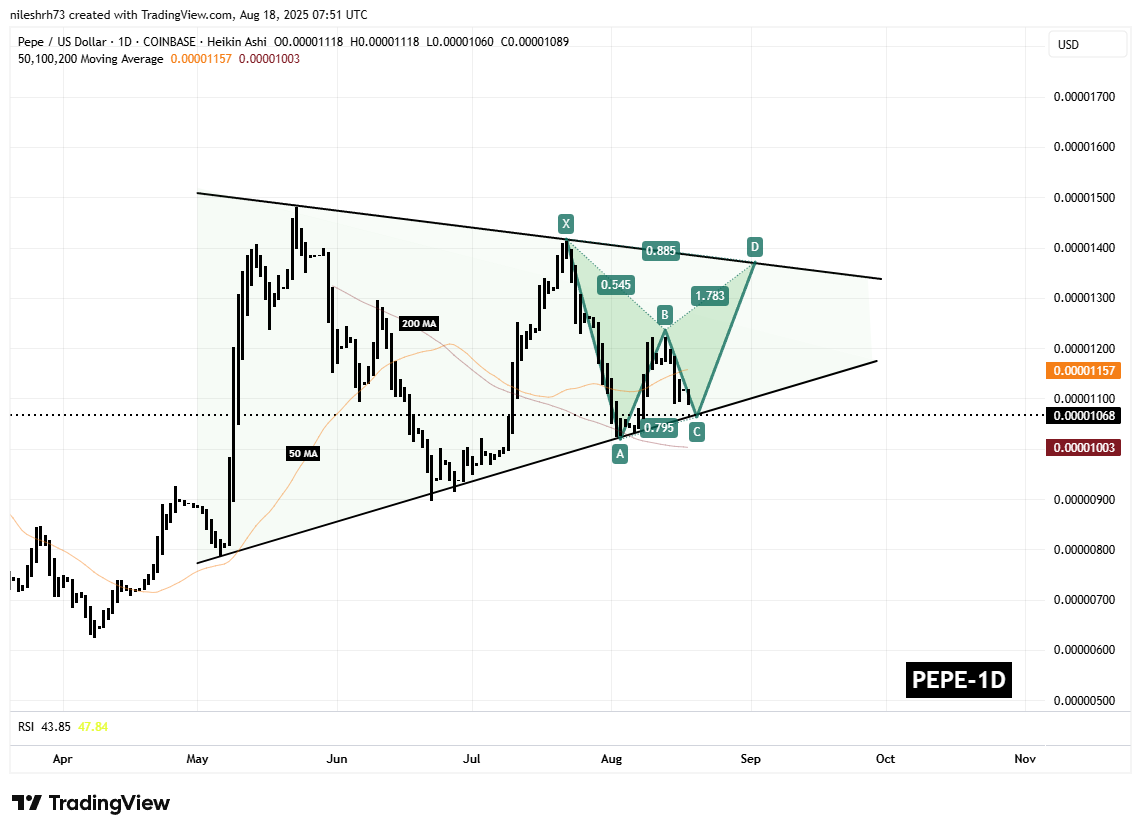
PEPE Daily Chart/Coinsprobe (Source: Tradingview)

At the same time, a bearish Bat harmonic pattern is also visible. The C point of this setup seems to be forming right at the lower trendline support, adding further significance to this zone.

What’s Next for PEPE?

If buyers manage to hold the $0.00001060 level, a rebound toward the 50-day moving average at $0.00001157 could provide early confirmation of the Bat pattern’s validity. A breakout above that level would open the door for a retest of the upper resistance trendline, potentially aligning with the D point ($0.00001371) of the harmonic structure.

0

Disclaimer: The content of this article solely reflects the author's opinion and does not represent the platform in any capacity. This article is not intended to serve as a reference for making investment decisions.

PoolX: Earn new token airdrops
Lock your assets and earn 10%+ APR
Lock now!