PENGU continues to plunge as insider wallet moves another $5.6M to exchanges

PENGU’s rally has reversed with a 17% weekly loss, as on-chain data points to one insider-linked wallet offloading over $17 million worth of tokens to exchanges since July.
- PENGU is down 17% in a week as a wallet linked to the deployer sent over $17M worth of tokens to exchanges.
- Technical indicators show early signs of weakness, with a bearish MACD crossover and falling RSI.
- Despite the correction, long-term trend lines remain bullish, supported by high trading volume.
The Pudgy Penguins ( PENGU ) token has declined sharply in recent days, falling 6.5% in the last 24 hours to $0.03533. Over the past week, the token is down 17% after reaching a local high of $0.0447 on July 27. Even with a 133% gain in the past 30 days, PENGU is still 48% below its all-time high of $0.06845 set in Dec. 2024.
Are PENGU insider preparing to dump?
On-chain data shared by pseudonymous analyst Ai shows that address 8hQvQ…zund8, connected to the PENGU deployment wallet, deposited 150 million tokens, worth around $5.64 million, to Binance on July 30.
This brings the total moved by the address to 485 million PENGU, about $17.67 million, since early July. More transfers have been recorded before this.
Over 2 billion tokens, totaling $66.6 million, were moved from the PENGU deployment address to centralized exchanges between July 12 and July 28. On July 28 alone, $8.91 million worth of those tokens were moved. Although some speculate that these actions might be related to partnerships or liquidity, the timing has sparked worries about a possible strategic dump.
Trading activity remains strong despite the recent concerns. The 24-hour spot volume for PENGU has risen 34% to $943.1 million, while the derivatives volume has increased to $2.76 billion, a 27% surge. A 1.76% decline in open interest, however, indicates that some traders may be reducing their short-term holdings.
PENGU technical analysis
PENGU is holding near its 20-day simple moving average at $0.0352. It has recently retreated from the upper Bollinger Band and is now nearer the $0.0245 lower band support. After reaching overbought levels above 73 earlier this week, the relative strength index has now dropped to 57.6.
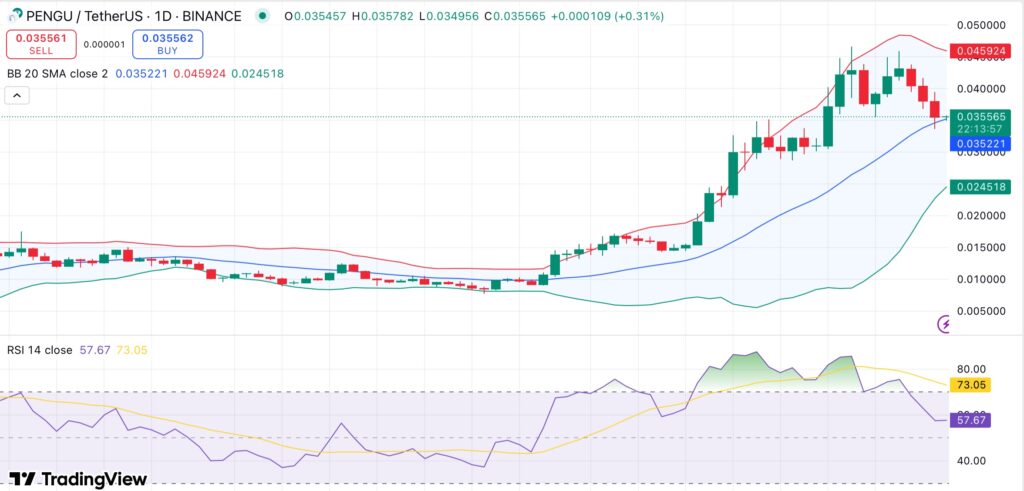 PENGU daily chart. Credit: crypto.news
The Stochastic RSI is currently in the lower zone, and the moving average convergence divergence has crossed below the signal line, two early indicators of waning momentum. The 50-day EMA sits at $0.0257, while the 200-day EMA remains lower at $0.0182, suggesting the long-term trend is still intact unless the current dip worsens.
The next support is located around $0.030 if PENGU is unable to hold above $0.035. For short-term sentiment to shift to bullish , a recovery above $0.038 would be required.
Disclaimer: The content of this article solely reflects the author's opinion and does not represent the platform in any capacity. This article is not intended to serve as a reference for making investment decisions.
You may also like
Morning News | Perpetual contract trading protocol Lighter completes $68 million financing; ALLO announces tokenomics; UNI surges nearly 40% in 24 hours
A summary of major market events on November 11.

Tom Lee Exclusive Interview: The Bull Market Has Just Begun, Ethereum May Hit $12,000 Next Year

Bitcoin ‘Wave 3’ expansion targets $200K as sell-side pressure fades: Analyst