
Hedera (HBAR) Price Climbs, But Diverging Indicators Suggest a Pullback Looms

Despite a recent price increase, Hedera's (HBAR) technical indicators point to weakening demand, signaling a possible pullback unless new momentum emerges.
HBAR has posted a 4% gain over the past seven days, benefiting from the broader rebound across the crypto market over the past few days.
However, despite the price uptick, technical indicators are flashing warning signs that the rally may lack strong support and could witness a reversal.
Hedera’s Rally May Be on Shaky Ground
HBAR’s Chaikin Money Flow (CMF) shows a steady decline even as the token’s price has rallied in recent days. As of this writing, the momentum indicator rests below the zero line at -0.16.
This forms a bearish divergence with the token’s price signaling weakening buying pressure behind the uptrend.
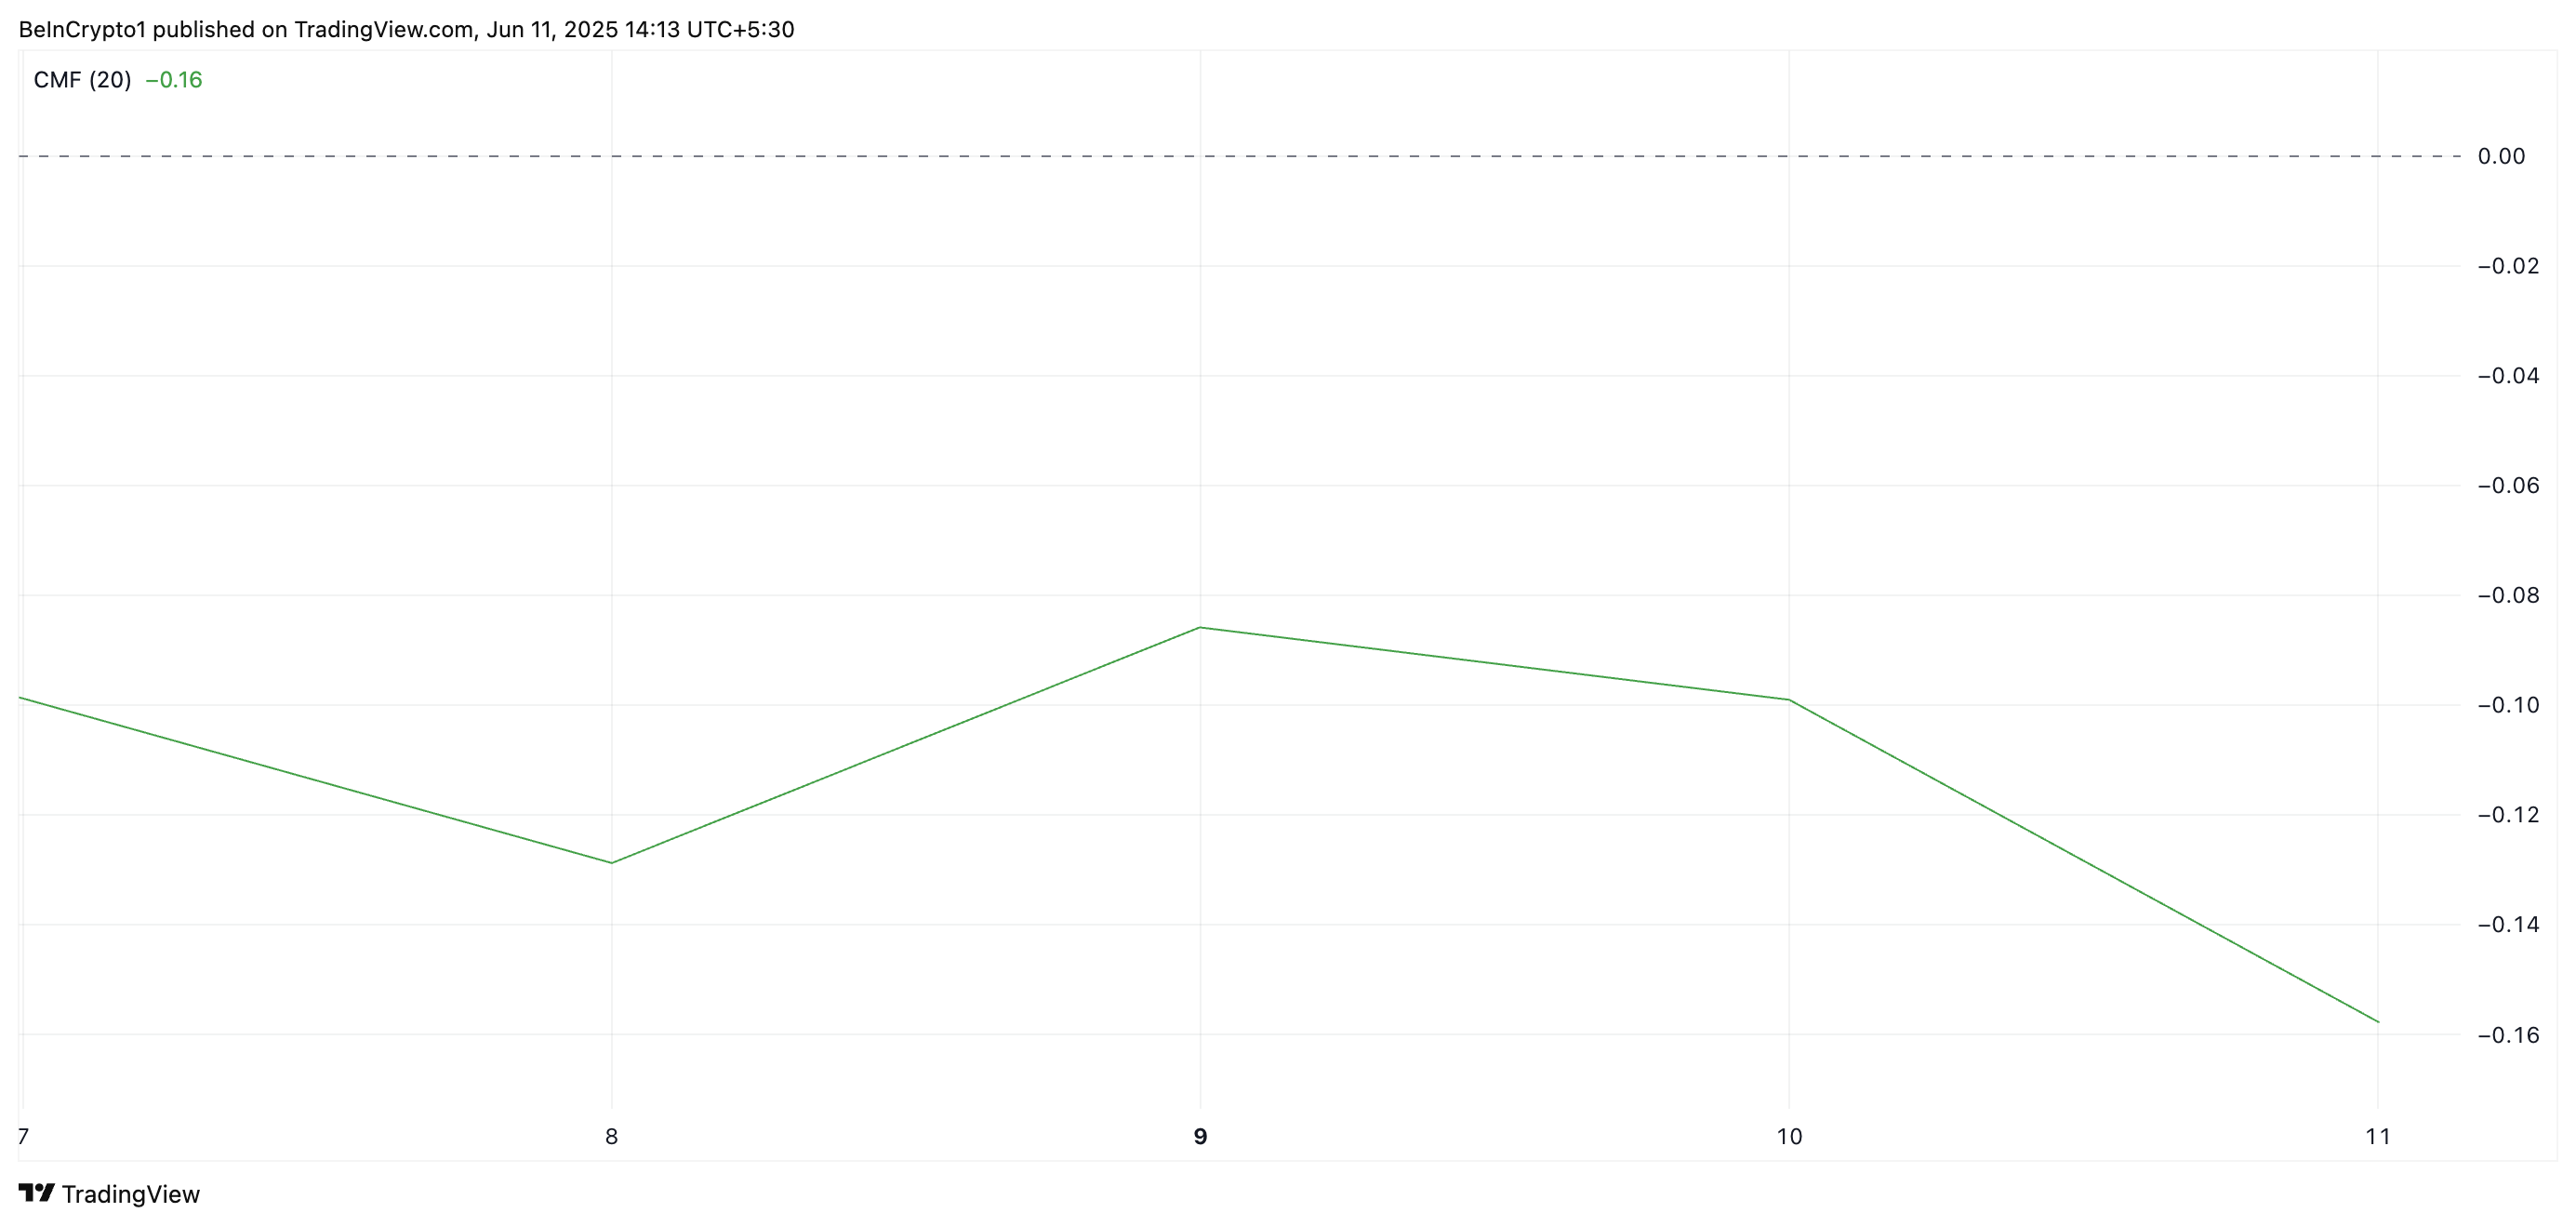 HBAR CMF. Source:
TradingView
HBAR CMF. Source:
TradingView
The CMF measures the volume-weighted money flow into or out of an asset over a specific period, helping gauge buying or selling pressure. A bearish divergence occurs when the asset’s price rises while the CMF trends downward, indicating weakening demand and potential for a reversal.
This trend suggests that HBAR’s recent rally is not driven by sustained demand from market participants and risks a correction in the near term.
Moreover, readings from the altcoin’s BBTrend indicator support this bearish outlook. Observed on the one-day chart, the indicator currently sits at -10.16, displaying red histogram bars that have been growing in size with each trading session.
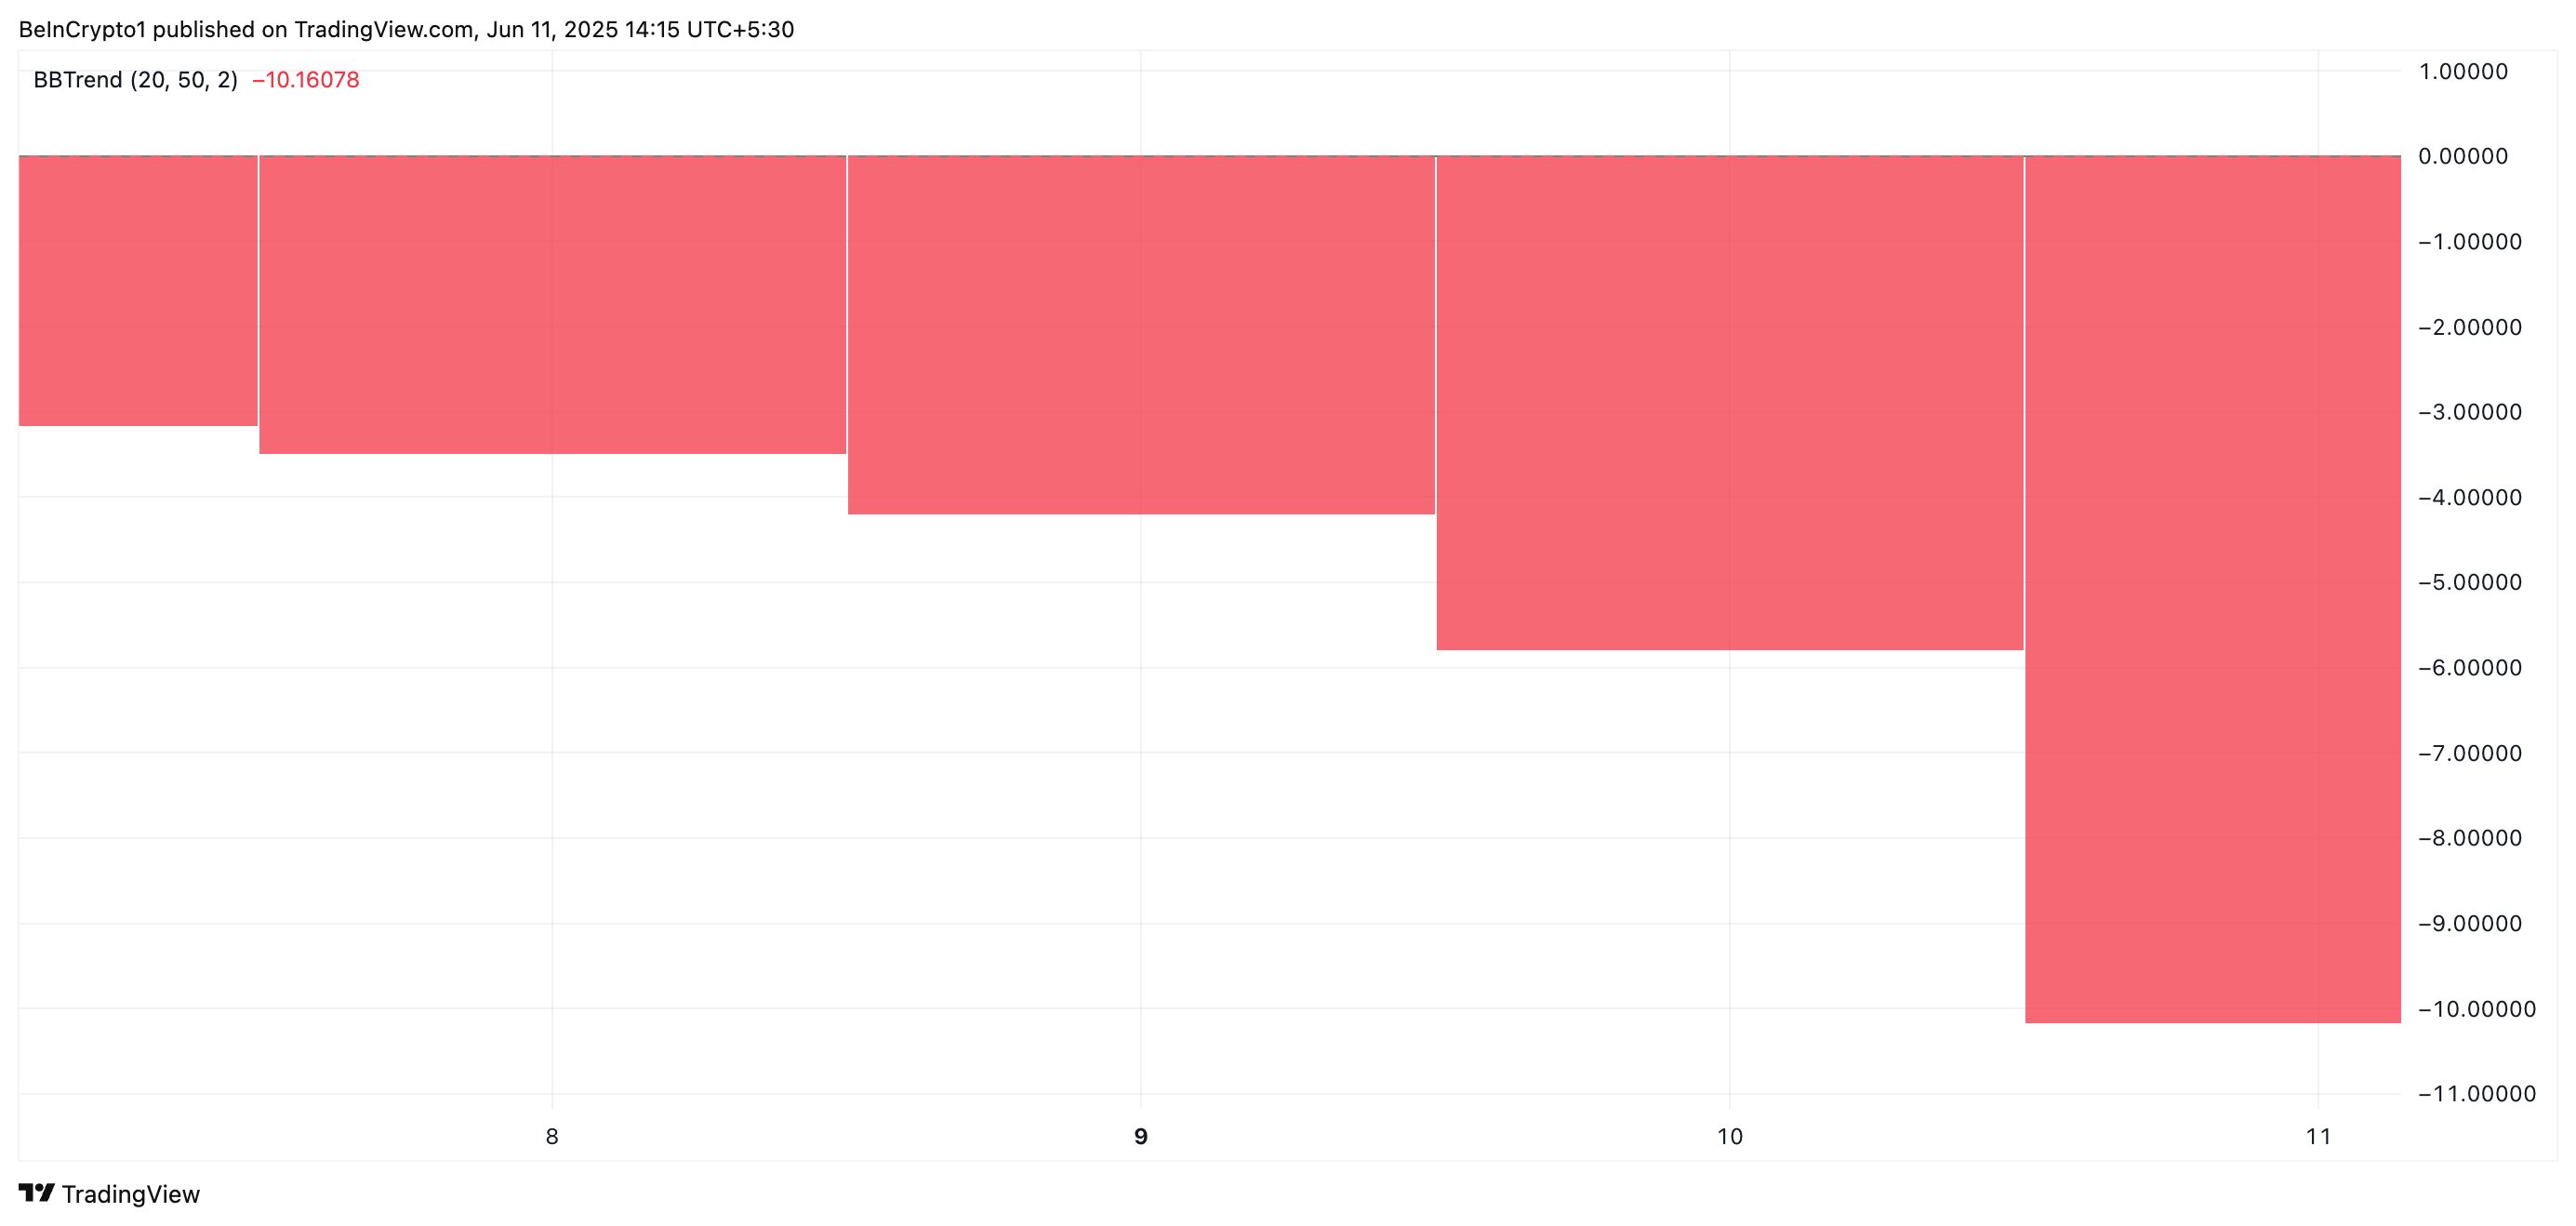 HBAR BBTrend. Source:
TradingView
HBAR BBTrend. Source:
TradingView
The BBTrend measures the strength and direction of a trend based on the expansion and contraction of Bollinger Bands. When it returns red bars, the asset’s price consistently closes near the lower Bollinger Band. This reflects sustained selling pressure and hinting at the potential for further downside.
In HBAR’s case, the divergence between its price movements and BBTrend confirms that the upward move lacks strong momentum and may be unsustainable.
HBAR at a Crossroads Between $0.166 and $0.188
HBAR currently exchanges hands at $0.18, trading just above the support level at $0.178. If bullish momentum in the broader crypto market fades and demand fails to climb, HBAR’s rally may lose steam. This could potentially push the price below the $0.178 support.
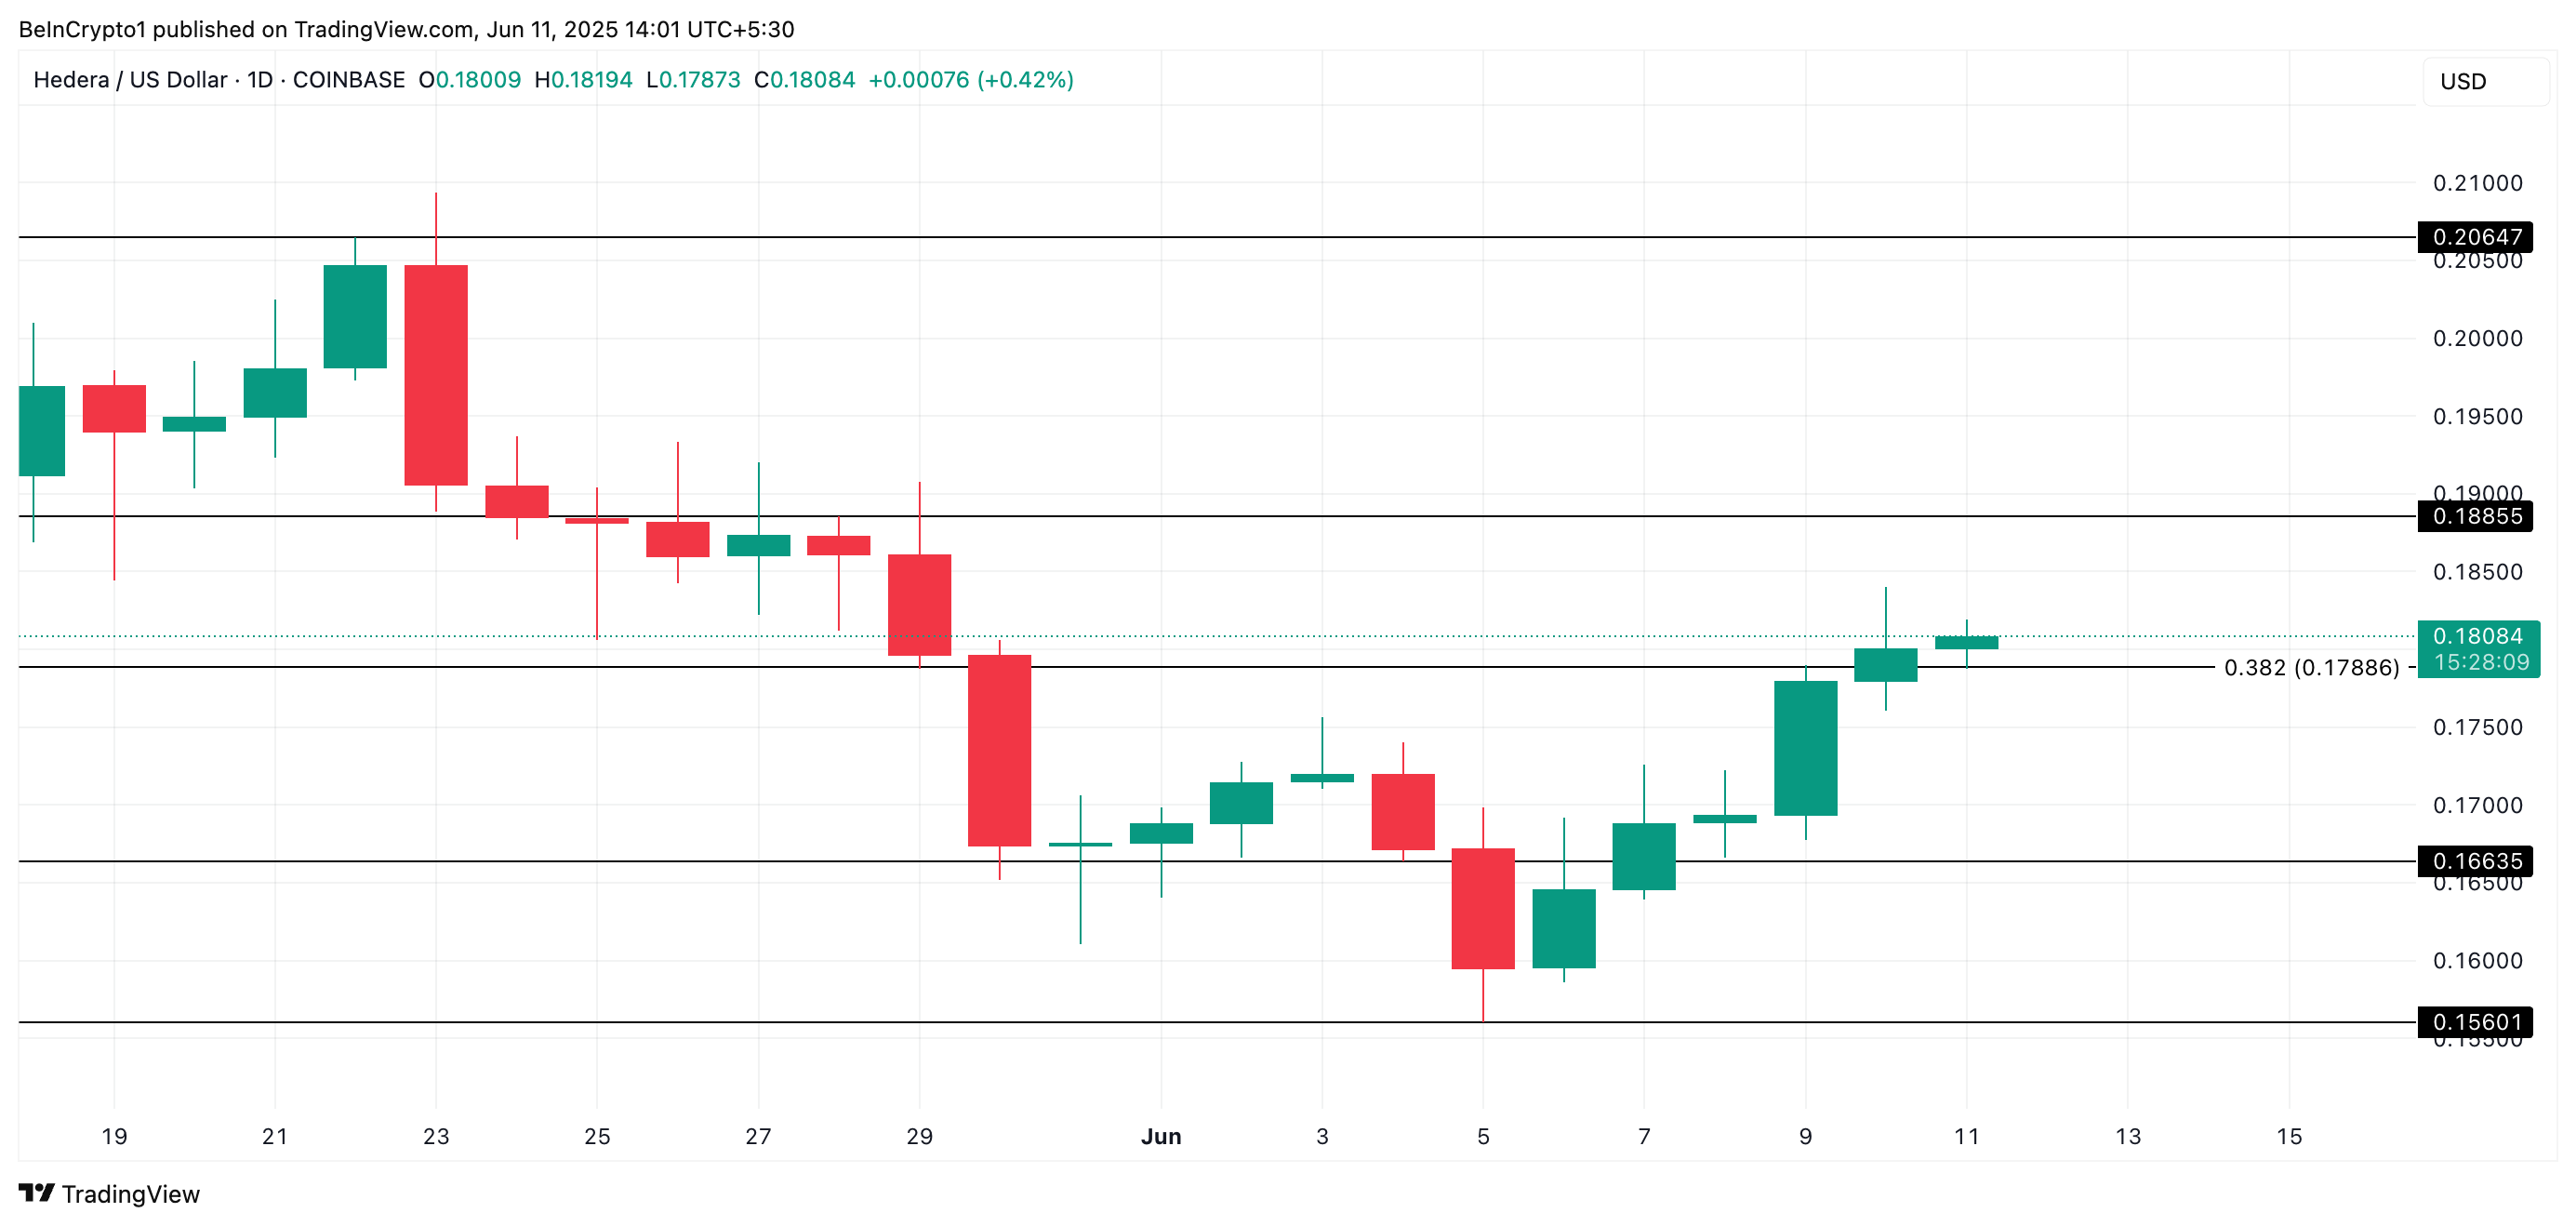 HBAR Price Analysis. Source:
TradingView
HBAR Price Analysis. Source:
TradingView
In this scenario, the token could slip further to $0.166.
On the other hand, if fresh demand enters the market, HBAR’s rally could regain strength and climb toward the $0.188 resistance level.
Disclaimer: The content of this article solely reflects the author's opinion and does not represent the platform in any capacity. This article is not intended to serve as a reference for making investment decisions.
You may also like
Kiyosaki Predicts Massive Money Printing
ETF Canary Launch Has Little Impact On XRP
Chainlink Dominates RWA With Technical Strength
Bitcoin Price Prediction: Short-Term Bounce On Cards, But With a Twist