Will Shiba Inu Price Reach $1 in May?

Shiba Inu (SHIB) , the self-proclaimed “Dogecoin killer,” has long captured investor imagination with dreams of hitting the elusive $1 mark. With May 2025 underway, SHIB price has shown subtle but noticeable shifts in momentum. But are these enough to spark a rally to $1, or are we staring at another meme-driven mirage? Let’s dive into the charts and indicators to uncover what Shiba Inu Price is actually signaling .
Shiba Inu Price Prediction: Bullish Build-Up or Resistance Trap?
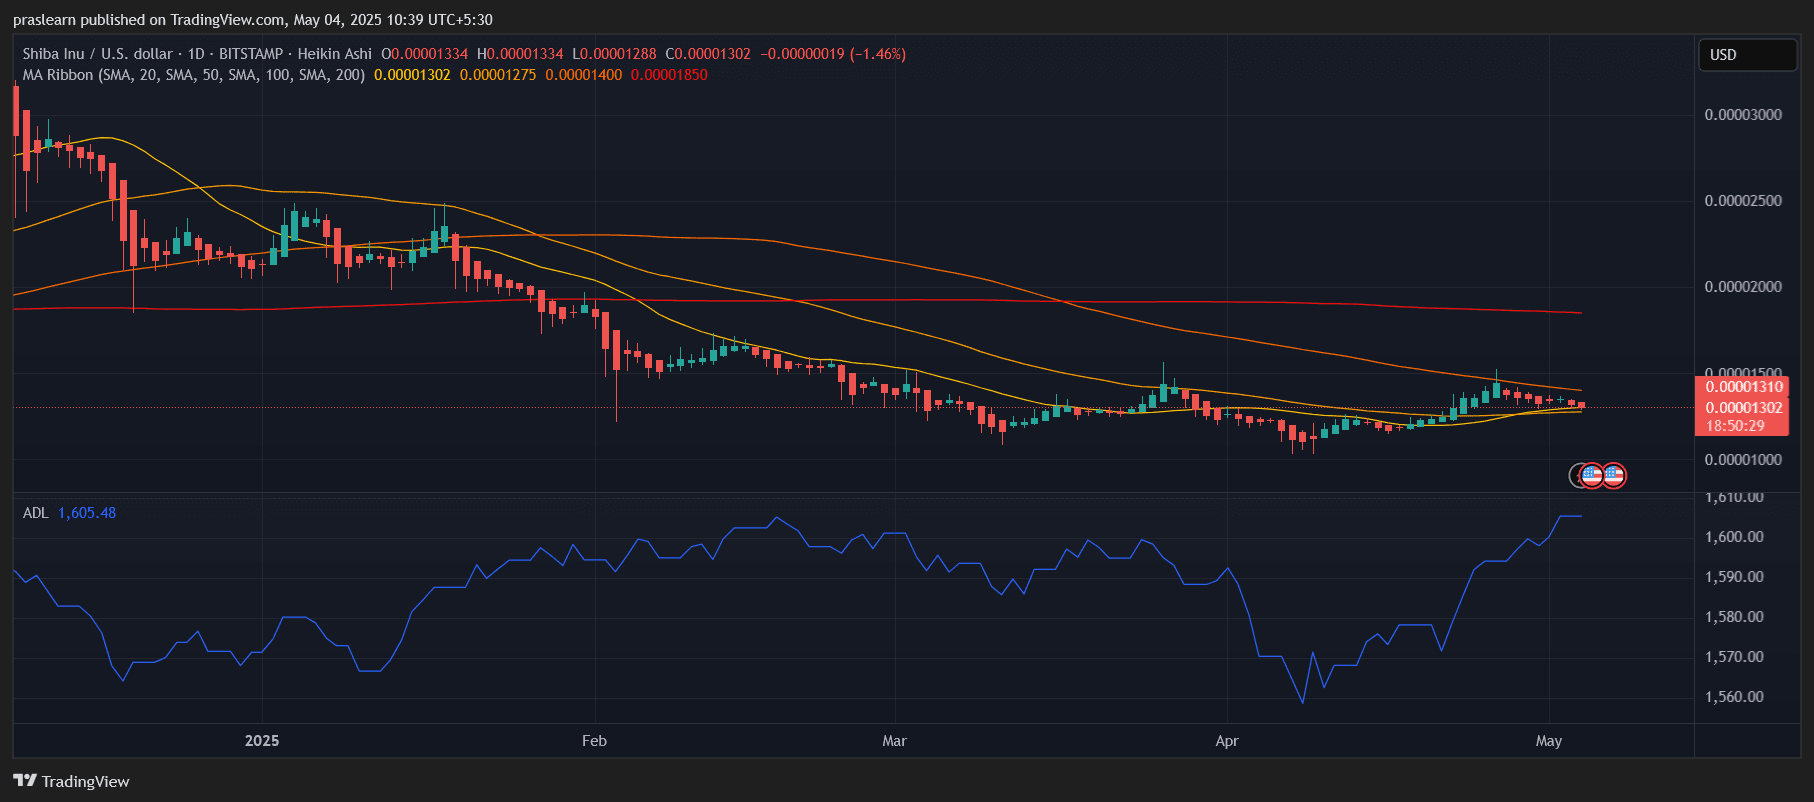 SHIB/USD Daily Chart- TradingView
On the daily chart, SHIB price is trading near $0.00001310 , stuck in a narrow range with downward Heikin Ashi candles indicating waning bullish pressure. It's currently riding just above the 20-day simple moving average (SMA) at $0.00001302, showing a tentative hold on short-term momentum. However, the 50-day SMA at $0.00001275 and 100-day SMA at $0.00001400 are closing in, suggesting a compression zone forming — a classic precursor to a breakout or breakdown.
The 200-day SMA at $0.00001850 still looms far overhead, representing a major long-term resistance zone. The narrowing gap between these moving averages is creating a triangle-like squeeze that typically resolves with high volatility. Volume remains muted, indicating traders are waiting for a trigger. Watch closely for a breakout above $0.00001450, which could clear a path toward $0.000018, a key level not seen since March.
Hourly Chart Insights: Short-Term Bounce in Play
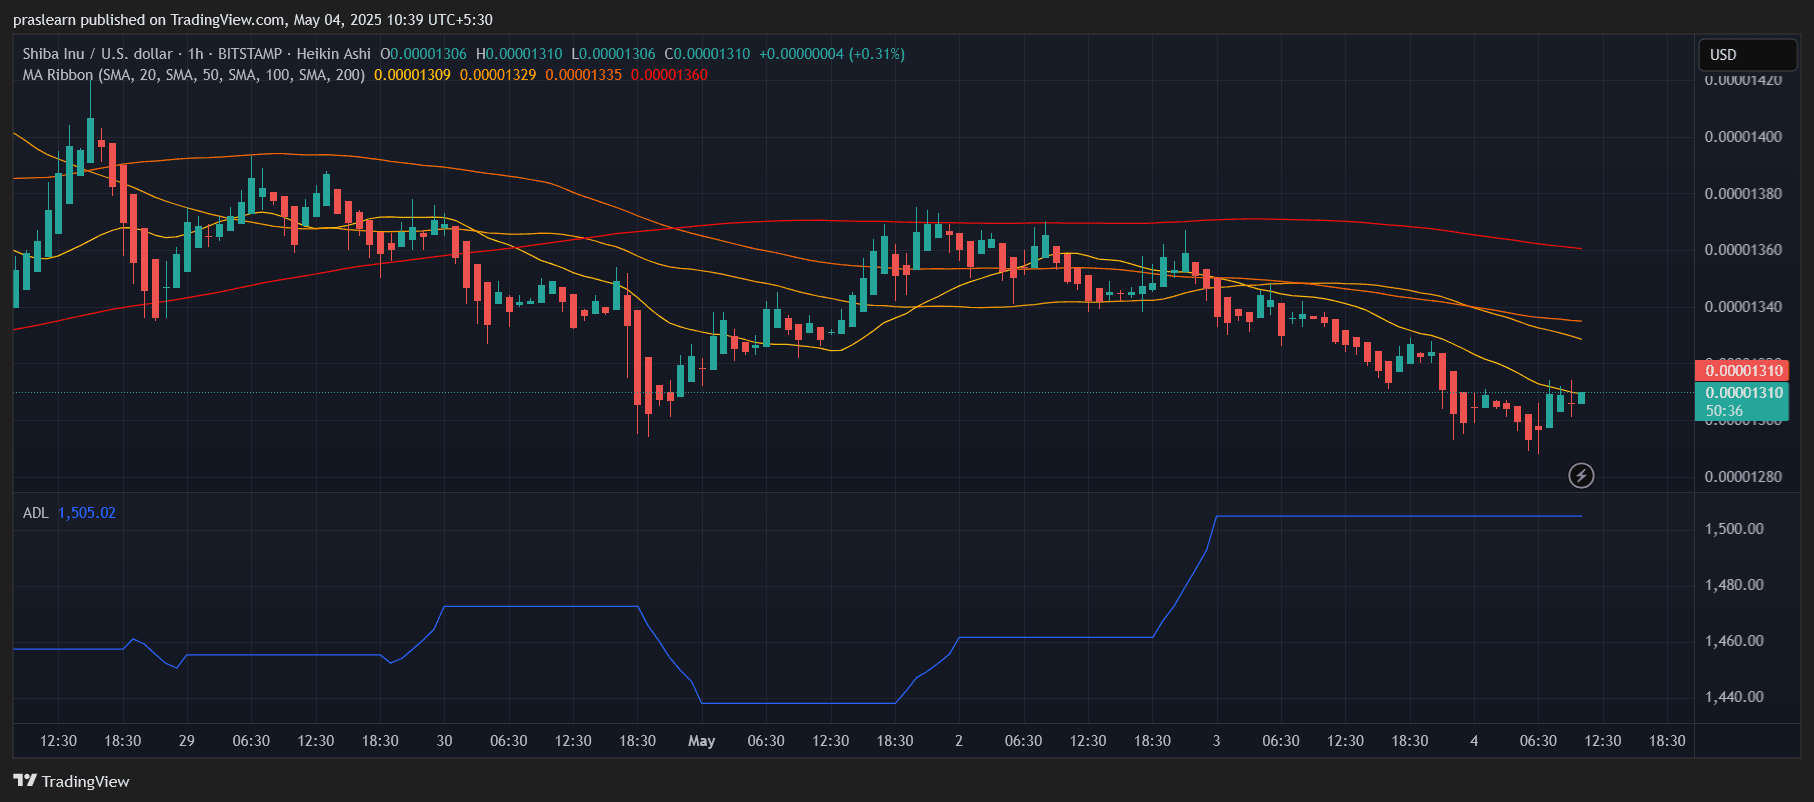 SHIB/USD 1 Hr Chart- TradingView
Zooming into the hourly chart, SHIB price has attempted a mild recovery after dipping below $0.00001300 on May 3. The price bounced from $0.00001280 and has since reclaimed the 50-hour SMA, currently at $0.00001329. However, resistance at the 100-hour SMA ($0.00001335) and 200-hour SMA ($0.00001360) is proving stiff.
Unless SHIB closes convincingly above $0.00001350 on the hourly timeframe, the bounce could fade. On the flip side, support around $0.00001280 remains strong and has acted as a launchpad twice in the past 48 hours.
The Accumulation/Distribution Line (ADL) is showing a steady rise, hinting that accumulation is quietly ongoing despite flat price action. This divergence often precedes a bullish move.
Momentum Check: Is SHIB Preparing for a Breakout?
The slope of the moving averages and the recent flattening of the ADL line suggest consolidation. However, this isn’t necessarily bearish — in fact, sideways movement after a recovery is often a sign that bulls are building strength. If SHIB can flip the 100-day SMA at $0.00001400 into support, we could see a quick run toward $0.000018, followed by $0.000022 if momentum accelerates.
But realistically, the notion of reaching $1 in May is still far-fetched. For that to happen, SHIB price would need an exponential gain of 7.6 million percent — which would require either a global fiat collapse or every central bank replacing their currency with Shiba Inu. Neither is likely.
Shiba Inu Price Prediction: Key Levels to Watch
- Immediate Support: $0.00001280
- Immediate Resistance: $0.00001350
- Breakout Trigger: $0.00001450
- Target Zones: $0.000018, $0.000022
What’s Next for SHIB in May?
Shiba Inu price is holding its ground despite facing stiff resistance across multiple moving averages. The technical indicators show potential for a breakout, but volume and market sentiment need to align for any significant move. While $1 remains more meme than reality, a rally toward $0.000018–$0.000022 isn’t out of the question if bulls push past near-term resistance.
In short, SHIB might not reach the moon this May, but it could still deliver a solid ride — especially for short-term traders watching the $0.000014 breakout zone.
Shiba Inu (SHIB) , the self-proclaimed “Dogecoin killer,” has long captured investor imagination with dreams of hitting the elusive $1 mark. With May 2025 underway, SHIB price has shown subtle but noticeable shifts in momentum. But are these enough to spark a rally to $1, or are we staring at another meme-driven mirage? Let’s dive into the charts and indicators to uncover what Shiba Inu Price is actually signaling .
Shiba Inu Price Prediction: Bullish Build-Up or Resistance Trap?
SHIB/USD Daily Chart- TradingView
On the daily chart, SHIB price is trading near $0.00001310 , stuck in a narrow range with downward Heikin Ashi candles indicating waning bullish pressure. It's currently riding just above the 20-day simple moving average (SMA) at $0.00001302, showing a tentative hold on short-term momentum. However, the 50-day SMA at $0.00001275 and 100-day SMA at $0.00001400 are closing in, suggesting a compression zone forming — a classic precursor to a breakout or breakdown.
The 200-day SMA at $0.00001850 still looms far overhead, representing a major long-term resistance zone. The narrowing gap between these moving averages is creating a triangle-like squeeze that typically resolves with high volatility. Volume remains muted, indicating traders are waiting for a trigger. Watch closely for a breakout above $0.00001450, which could clear a path toward $0.000018, a key level not seen since March.
Hourly Chart Insights: Short-Term Bounce in Play
SHIB/USD 1 Hr Chart- TradingView
Zooming into the hourly chart, SHIB price has attempted a mild recovery after dipping below $0.00001300 on May 3. The price bounced from $0.00001280 and has since reclaimed the 50-hour SMA, currently at $0.00001329. However, resistance at the 100-hour SMA ($0.00001335) and 200-hour SMA ($0.00001360) is proving stiff.
Unless SHIB closes convincingly above $0.00001350 on the hourly timeframe, the bounce could fade. On the flip side, support around $0.00001280 remains strong and has acted as a launchpad twice in the past 48 hours.
The Accumulation/Distribution Line (ADL) is showing a steady rise, hinting that accumulation is quietly ongoing despite flat price action. This divergence often precedes a bullish move.
Momentum Check: Is SHIB Preparing for a Breakout?
The slope of the moving averages and the recent flattening of the ADL line suggest consolidation. However, this isn’t necessarily bearish — in fact, sideways movement after a recovery is often a sign that bulls are building strength. If SHIB can flip the 100-day SMA at $0.00001400 into support, we could see a quick run toward $0.000018, followed by $0.000022 if momentum accelerates.
But realistically, the notion of reaching $1 in May is still far-fetched. For that to happen, SHIB price would need an exponential gain of 7.6 million percent — which would require either a global fiat collapse or every central bank replacing their currency with Shiba Inu. Neither is likely.
Shiba Inu Price Prediction: Key Levels to Watch
- Immediate Support: $0.00001280
- Immediate Resistance: $0.00001350
- Breakout Trigger: $0.00001450
- Target Zones: $0.000018, $0.000022
What’s Next for SHIB in May?
Shiba Inu price is holding its ground despite facing stiff resistance across multiple moving averages. The technical indicators show potential for a breakout, but volume and market sentiment need to align for any significant move. While $1 remains more meme than reality, a rally toward $0.000018–$0.000022 isn’t out of the question if bulls push past near-term resistance.
In short, SHIB might not reach the moon this May, but it could still deliver a solid ride — especially for short-term traders watching the $0.000014 breakout zone.
Disclaimer: The content of this article solely reflects the author's opinion and does not represent the platform in any capacity. This article is not intended to serve as a reference for making investment decisions.
You may also like
Interview with VanEck Investment Manager: From an Institutional Perspective, Should You Buy BTC Now?
The support levels near $78,000 and $70,000 present a good entry opportunity.

Macroeconomic Report: How Trump, the Federal Reserve, and Trade Sparked the Biggest Market Volatility in History
The deliberate devaluation of the US dollar, combined with extreme cross-border imbalances and excessive valuations, is brewing a volatility event.
Vitalik donated 256 ETH to two chat apps you've never heard of—what exactly is he betting on?
He made it clear: neither of these two applications is perfect, and there is still a long way to go to achieve true user experience and security.
Prediction Market Supercycle