Date: Thu, April 24, 2025 | 05:58 AM GMT
The crypto market seems to be shaking off the dust after a brutal Q1 — Ethereum (ETH) alone dropped 45%. But things are finally starting to flip. ETH has bounced back with a 10% gain over the past week, and this positive momentum is spreading across altcoins .
Following this broader market rally, Aptos (APT) — which recently went through a major correction — has managed to pull off a noticeable comeback. The altcoin surged by 16% over the past week, trimming its year-to-date losses to around 49%. Even more compelling, a classic harmonic pattern forming on the daily chart suggests this move might just be getting started.
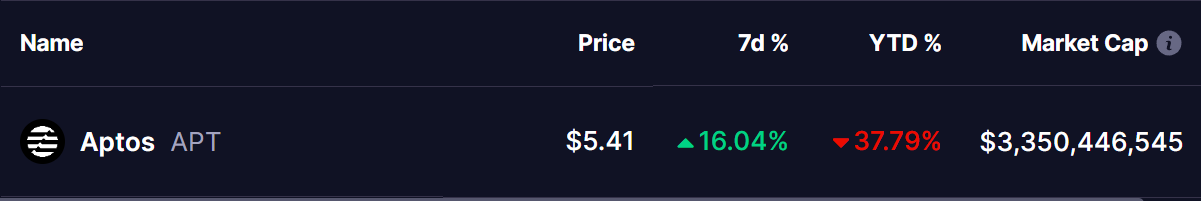 Source: Coinmarketcap
Harmonic Pattern Signals More Upside Ahead
Looking at APT’s daily chart through Heikin Ashi candles, a Bearish Cypher pattern has clearly formed — a setup that, despite its name, often leads to a bullish continuation toward the key reversal zone, also known as the Potential Reversal Zone (D).
The pattern starts at point X, where APT faced rejection from the January 7 high of $10.65. This was followed by a sharp decline to point A, then a short-lived recovery toward point B, and another deep correction to point C, which found support around $3.89 on April 7.
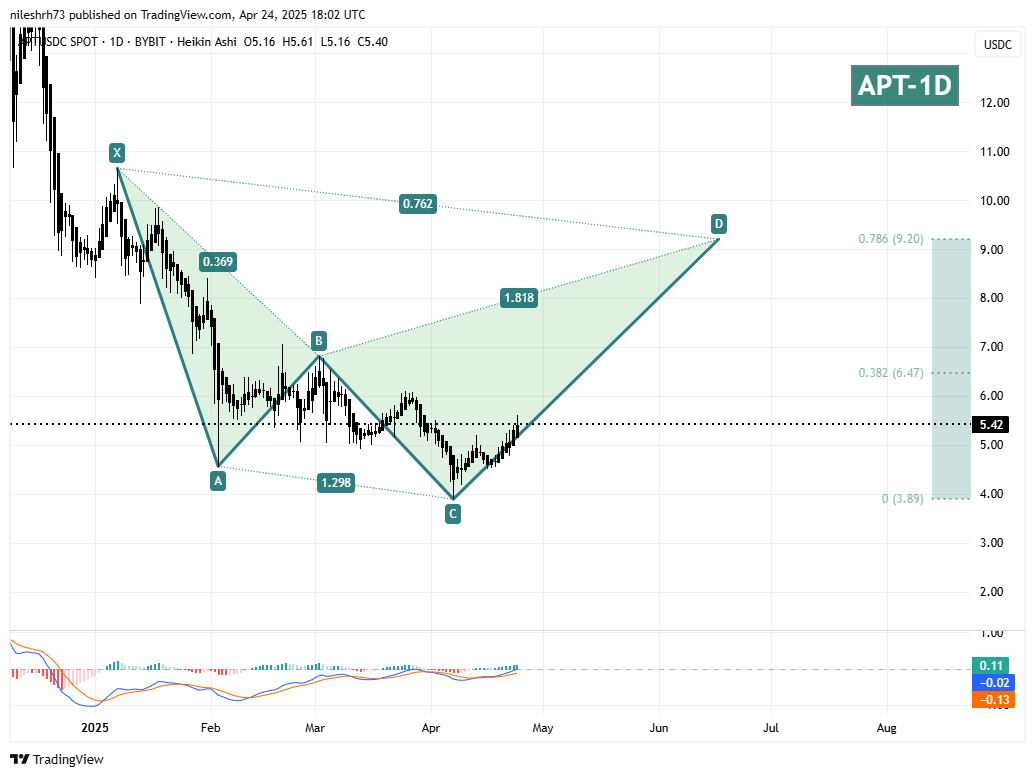 Aptos (APT) Daily Chart/Coinsprobe (Source: Tradingview)
This drop marked a 64% decline from point X. While some of the legs deviate slightly from perfect Fibonacci measurements, the overall structure still holds strong and remains valid from a harmonic trading perspective.
Currently, APT is climbing its way through the final leg — from point C to point D — and price action suggests that this move still has room to extend further.
What’s Next for APT?
If the pattern completes as expected, point D — which aligns with the 78.6% Fibonacci retracement from the X to C leg — sits around $9.20. This implies a potential 70% upside from the current price of $5.41.
However, before Aptos can reach that target, it will need to overcome an intermediate resistance near $6.47. This level corresponds to the 38.2% Fibonacci retracement and may serve as a key test for bullish momentum. A clean breakout above this zone could open the door for an accelerated move toward the final target.
Disclaimer: This article is for informational purposes only and not financial advice. Always conduct your own research before investing in cryptocurrencies.