
Bitcoin Price Reclaims $100K: Is the Bull Run Back On?

Bitcoin price remained supported above the $95,500 zone. BTC is up over 5% and is now trading above the $100,00 resistance zone.
- Bitcoin started a fresh increase above the $97,500 zone.
- The price is trading above $98,800 and the 100 hourly Simple moving average.
- There was a break above a key bearish trend line with resistance at $97,500 on the hourly chart of the BTC/USD pair (data feed from Kraken).
- The pair could correct some gains before it attempts to surpass the $102,000 resistance zone.
Bitcoin Price Regains Strength
Bitcoin price formed a base and started a fresh increase above the $98,000 zone. There was a move above the $98,800 and $99,200 levels.
During the increase, there was a break above a key bearish trend line with resistance at $97,500 on the hourly chart of the BTC/USD pair. The pair even cleared the $100,000 level. A high was formed at $101,900 and the price is now consolidating gains .
It is slowly moving lower toward the 23.6% Fib retracement level of the recent wave from the $94,314 swing low to the $101,900 high. Bitcoin price is now trading above $100,000 and the 100 hourly Simple moving average.
Source: BTCUSD on TradingView.comOn the upside, the price could face resistance near the $101,400 level. The first key resistance is near the $102,000 level. A clear move above the $102,000 resistance might send the price higher. The next key resistance could be $104,000. A close above the $104,000 resistance might send the price further higher. In the stated case, the price could rise and test the $105,000 resistance level. Any more gains might send the price toward the $108,000 level.
Another Decline In BTC?
If Bitcoin fails to rise above the $102,000 resistance zone, it could start another downside correction. Immediate support on the downside is near the $100,000 level.
The first major support is near the $98,200 level or the 50% Fib retracement level of the recent wave from the $94,314 swing low to the $101,900 high. The next support is now near the $97,250 zone. Any more losses might send the price toward the $95,000 support in the near term.
Technical indicators:
Hourly MACD – The MACD is now gaining pace in the bullish zone.
Hourly RSI (Relative Strength Index) – The RSI for BTC/USD is now above the 50 level.
Major Support Levels – $100,200, followed by $98,200.
Major Resistance Levels – $102,000, and $104,000.
Disclaimer: The content of this article solely reflects the author's opinion and does not represent the platform in any capacity. This article is not intended to serve as a reference for making investment decisions.
You may also like
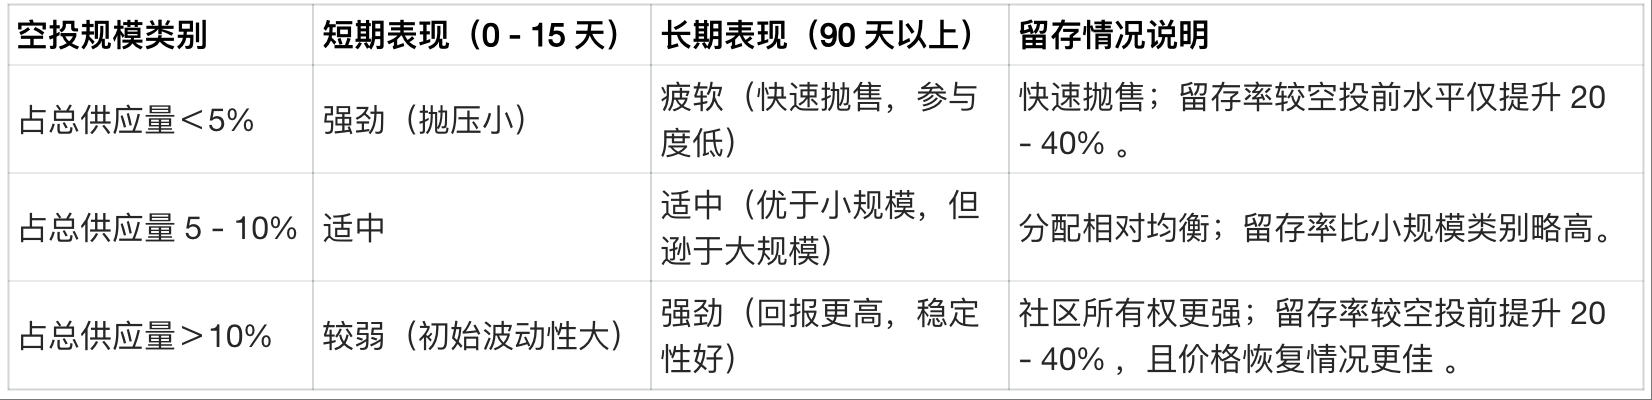
How to evaluate whether an airdrop is worth participating in from six key dimensions?
Airdrop evaluation is both an "art and a science": it requires understanding human incentives and crypto narratives (art), as well as analyzing data and tokenomics (science).
Raking in crypto dividends: How did the family of Trump's Commerce Secretary earn $2.5 billion a year?
After Howard Lutnick became the Secretary of Commerce in the Trump administration, his family's investment bank, Cantor, is heading for its most profitable year ever.

Qianwen app: How will Alibaba create China’s “ChatGPT”?
This is the third time this year that Alibaba has concentrated its efforts on major initiatives.
Real Vision founder: Federal Reserve may adjust policy to address liquidity crisis