Solana (SOL) Weekly Chart Targets $300 Breakout Following Bullish Setup

Solana’s bullish flag pattern and rising social volume indicate potential for a breakout. Trading above strong support, SOL eyes $300 as its next target.
Solana (SOL) appears ready for a significant breakout as its weekly chart reveals a compelling bullish setup. Over the last few days, Solana’s price has been consolidating despite hitting a new all-time high on November 22.
But if the altcoin breaks through critical resistance levels, it could hit $300. Here is how.
Solana Has Indicators on Its Side
On Solana’s weekly chart, the altcoin has formed a classic bull flag pattern — a bullish indicator suggesting potential further upward movement.
A bull flag consists of two rallies separated by a brief period of consolidation. The flagpole forms during a sharp, nearly vertical price spike as buyers overpower sellers. This is followed by a pullback phase, creating parallel upper and lower trendlines that resemble a flag.
As seen below, SOL has broken out of this pattern, indicating that the consolidation period is over. Hence, the uptrend could continue, and the token could be set for a sustained rally. If this trend continues, Solana’s price could climb above its all-time high of $264.66.
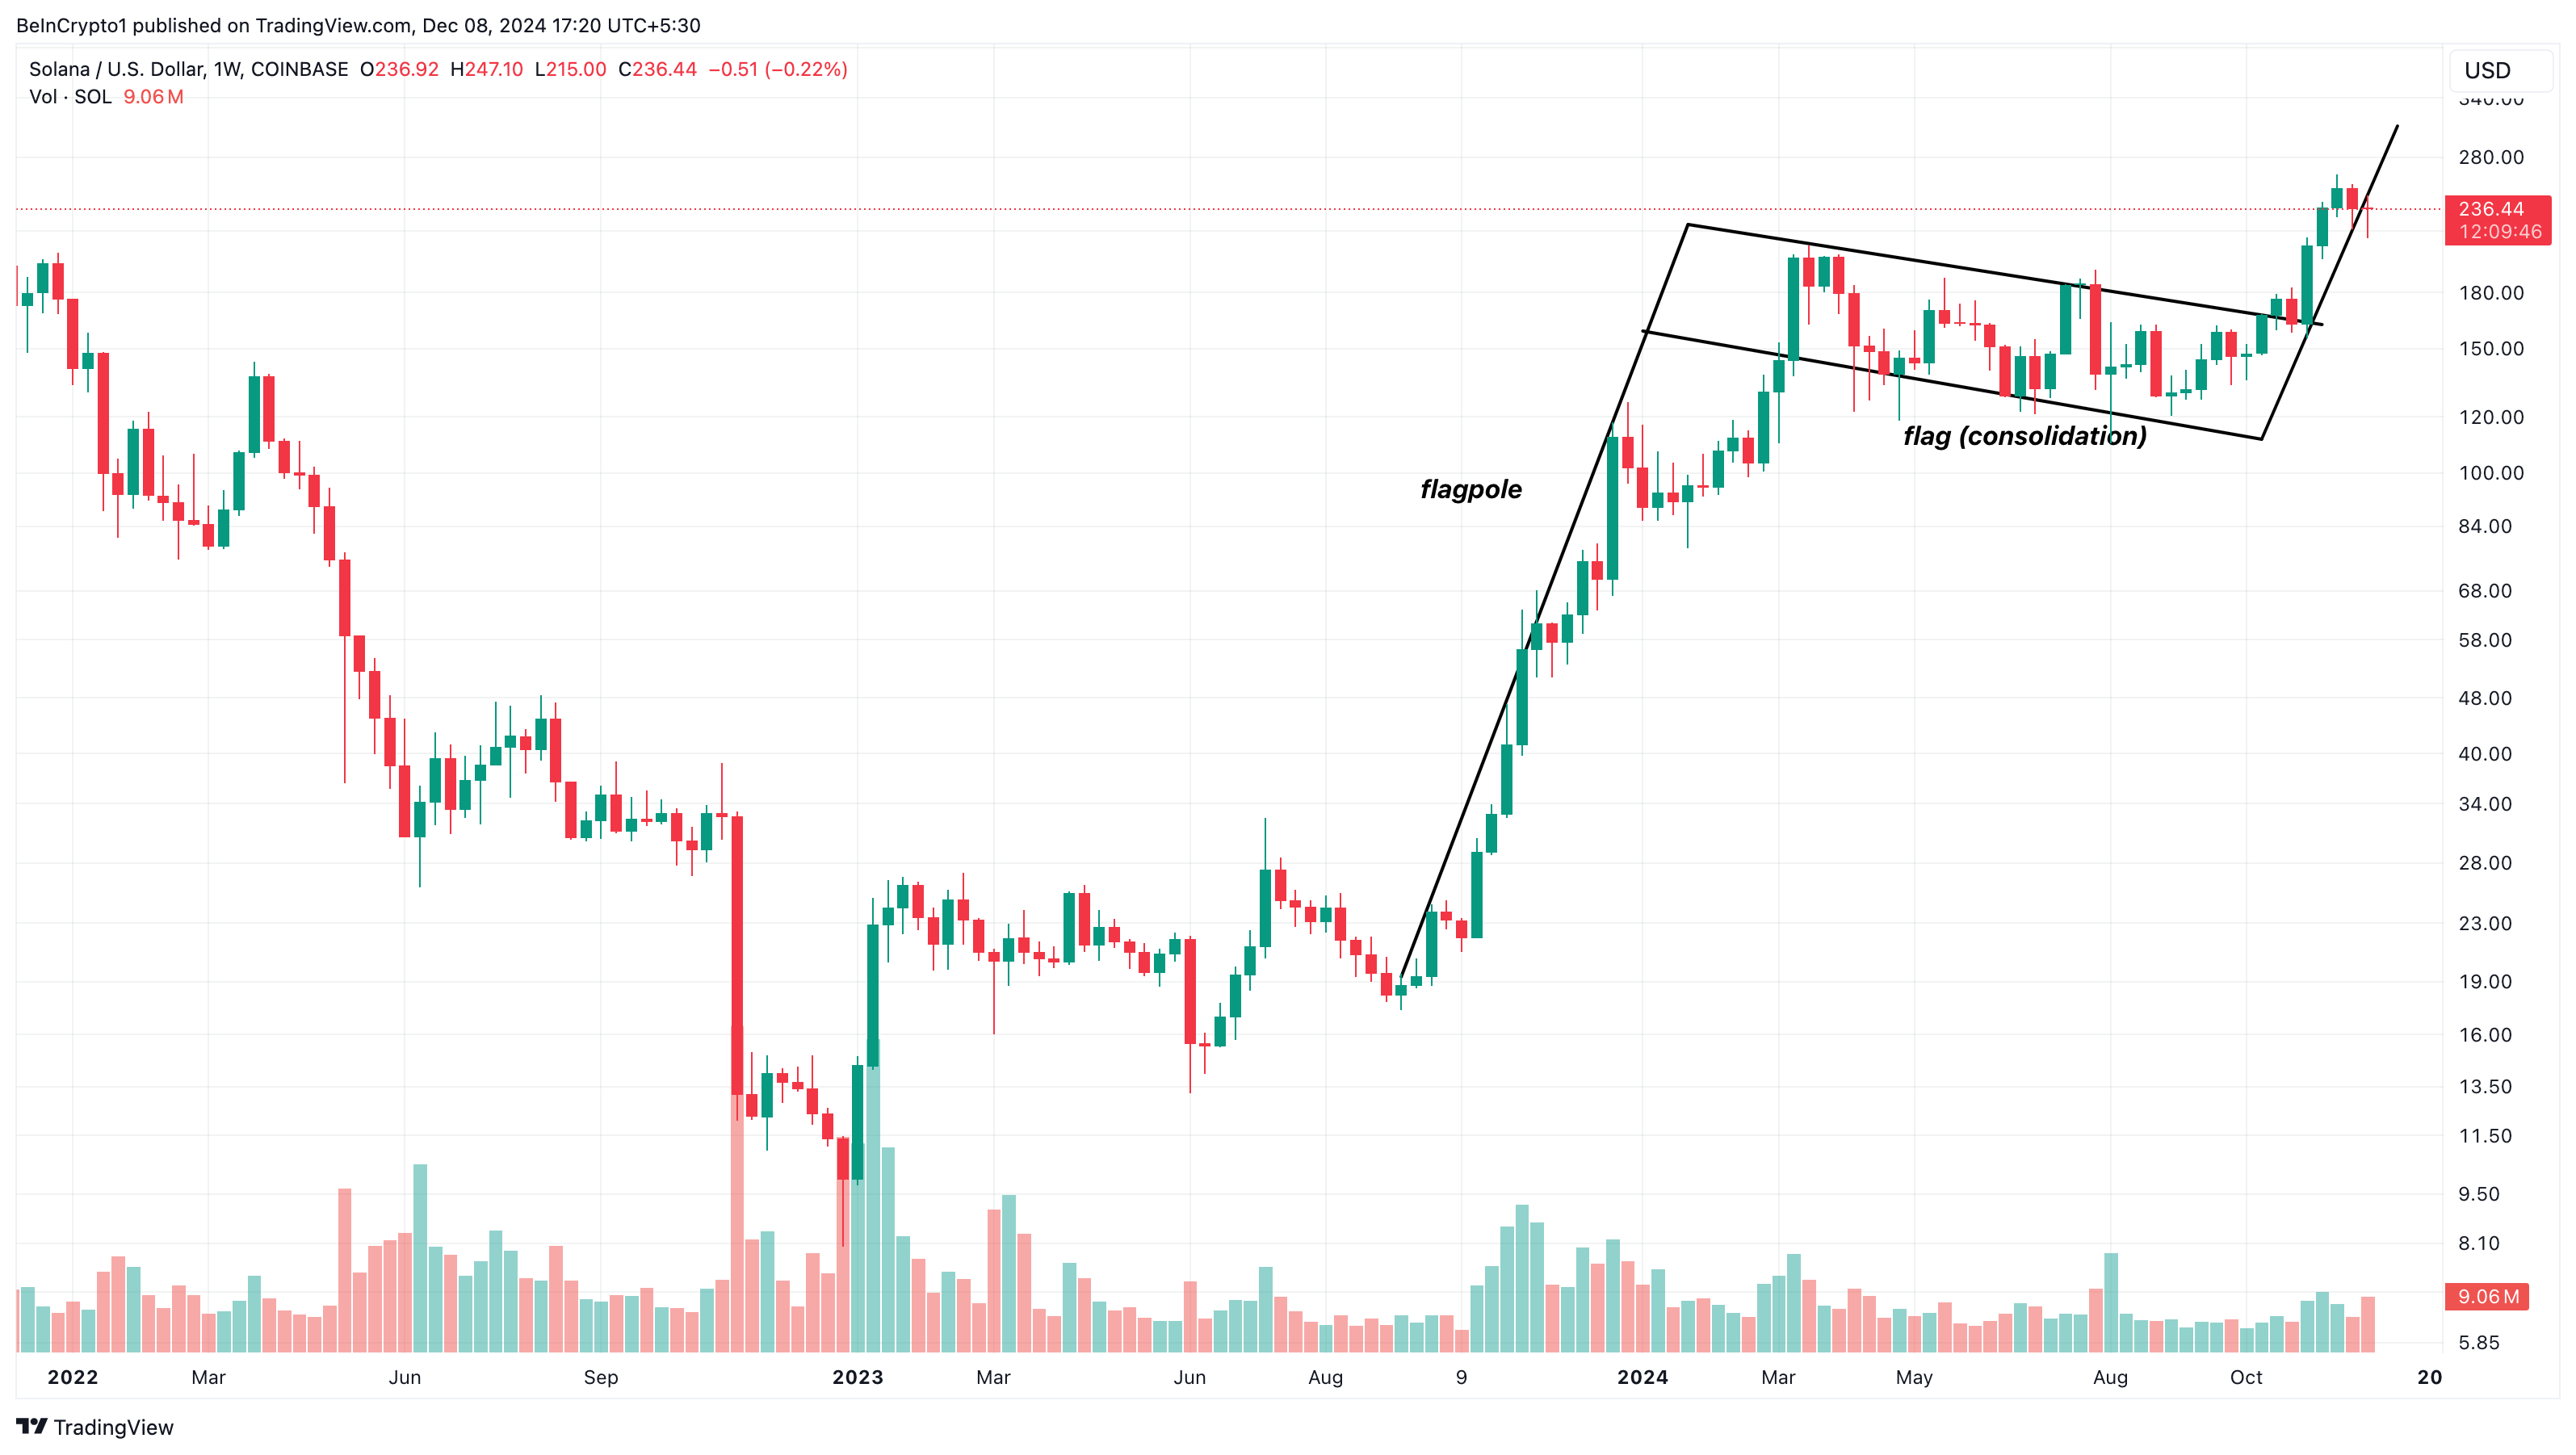 Solana Weekly Analysis. Source:
TradingView
Solana Weekly Analysis. Source:
TradingView
Amid this bullish setup, on-chain data from Santiment shows an increase in Solana’s social volume. Built on top of social data, this metric measures the search text related to a cryptocurrency on different online platforms.
When it increases, it implies that the search for the assets has increased. In most cases, this translates to rising demand. On the other hand, a drop in social volume indicates that the search for the assets has dropped, suggesting low interest in the cryptocurrency.
Therefore, the recent rise in SOL’s social dominance suggests that, if sustained, the token could soon trade higher than $236.
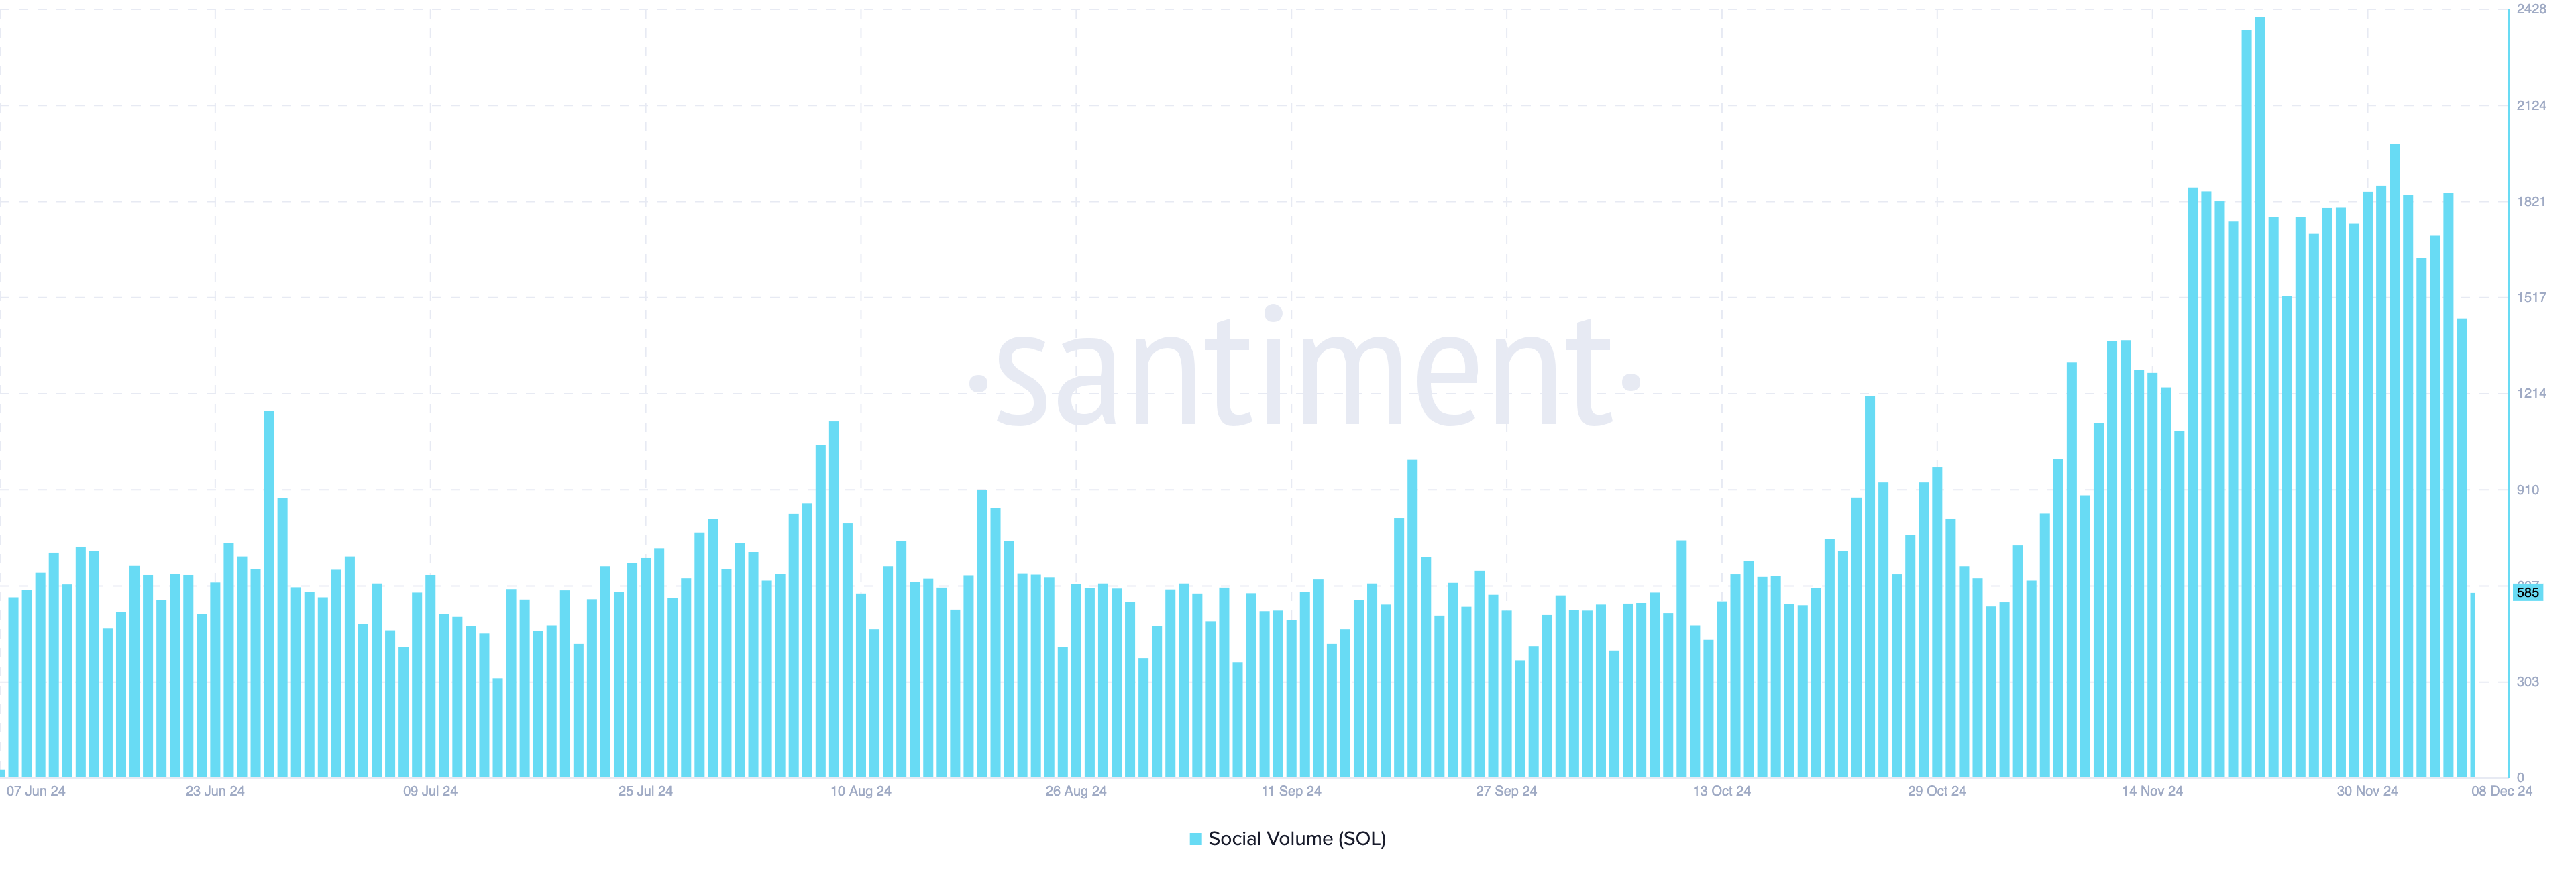 Solana Social Volume. Source:
Santiment
Solana Social Volume. Source:
Santiment
SOL Price Prediction: Consolidation Almost Over
Meanwhile, on the daily chart, SOL price is trading above the Ichimoku Cloud. The Ichimoku Cloud is a technical analysis tool designed to identify support and resistance levels, momentum, and trend direction in a single view.
Comprised of multiple components, the indicator offers insights into potential price movements. The cloud itself represents key support and resistance zones.
When the cloud is above the price, it indicates resistance, suggesting that retracement could be likely. But in this case, Solana’s price is above it, indicating strong support.
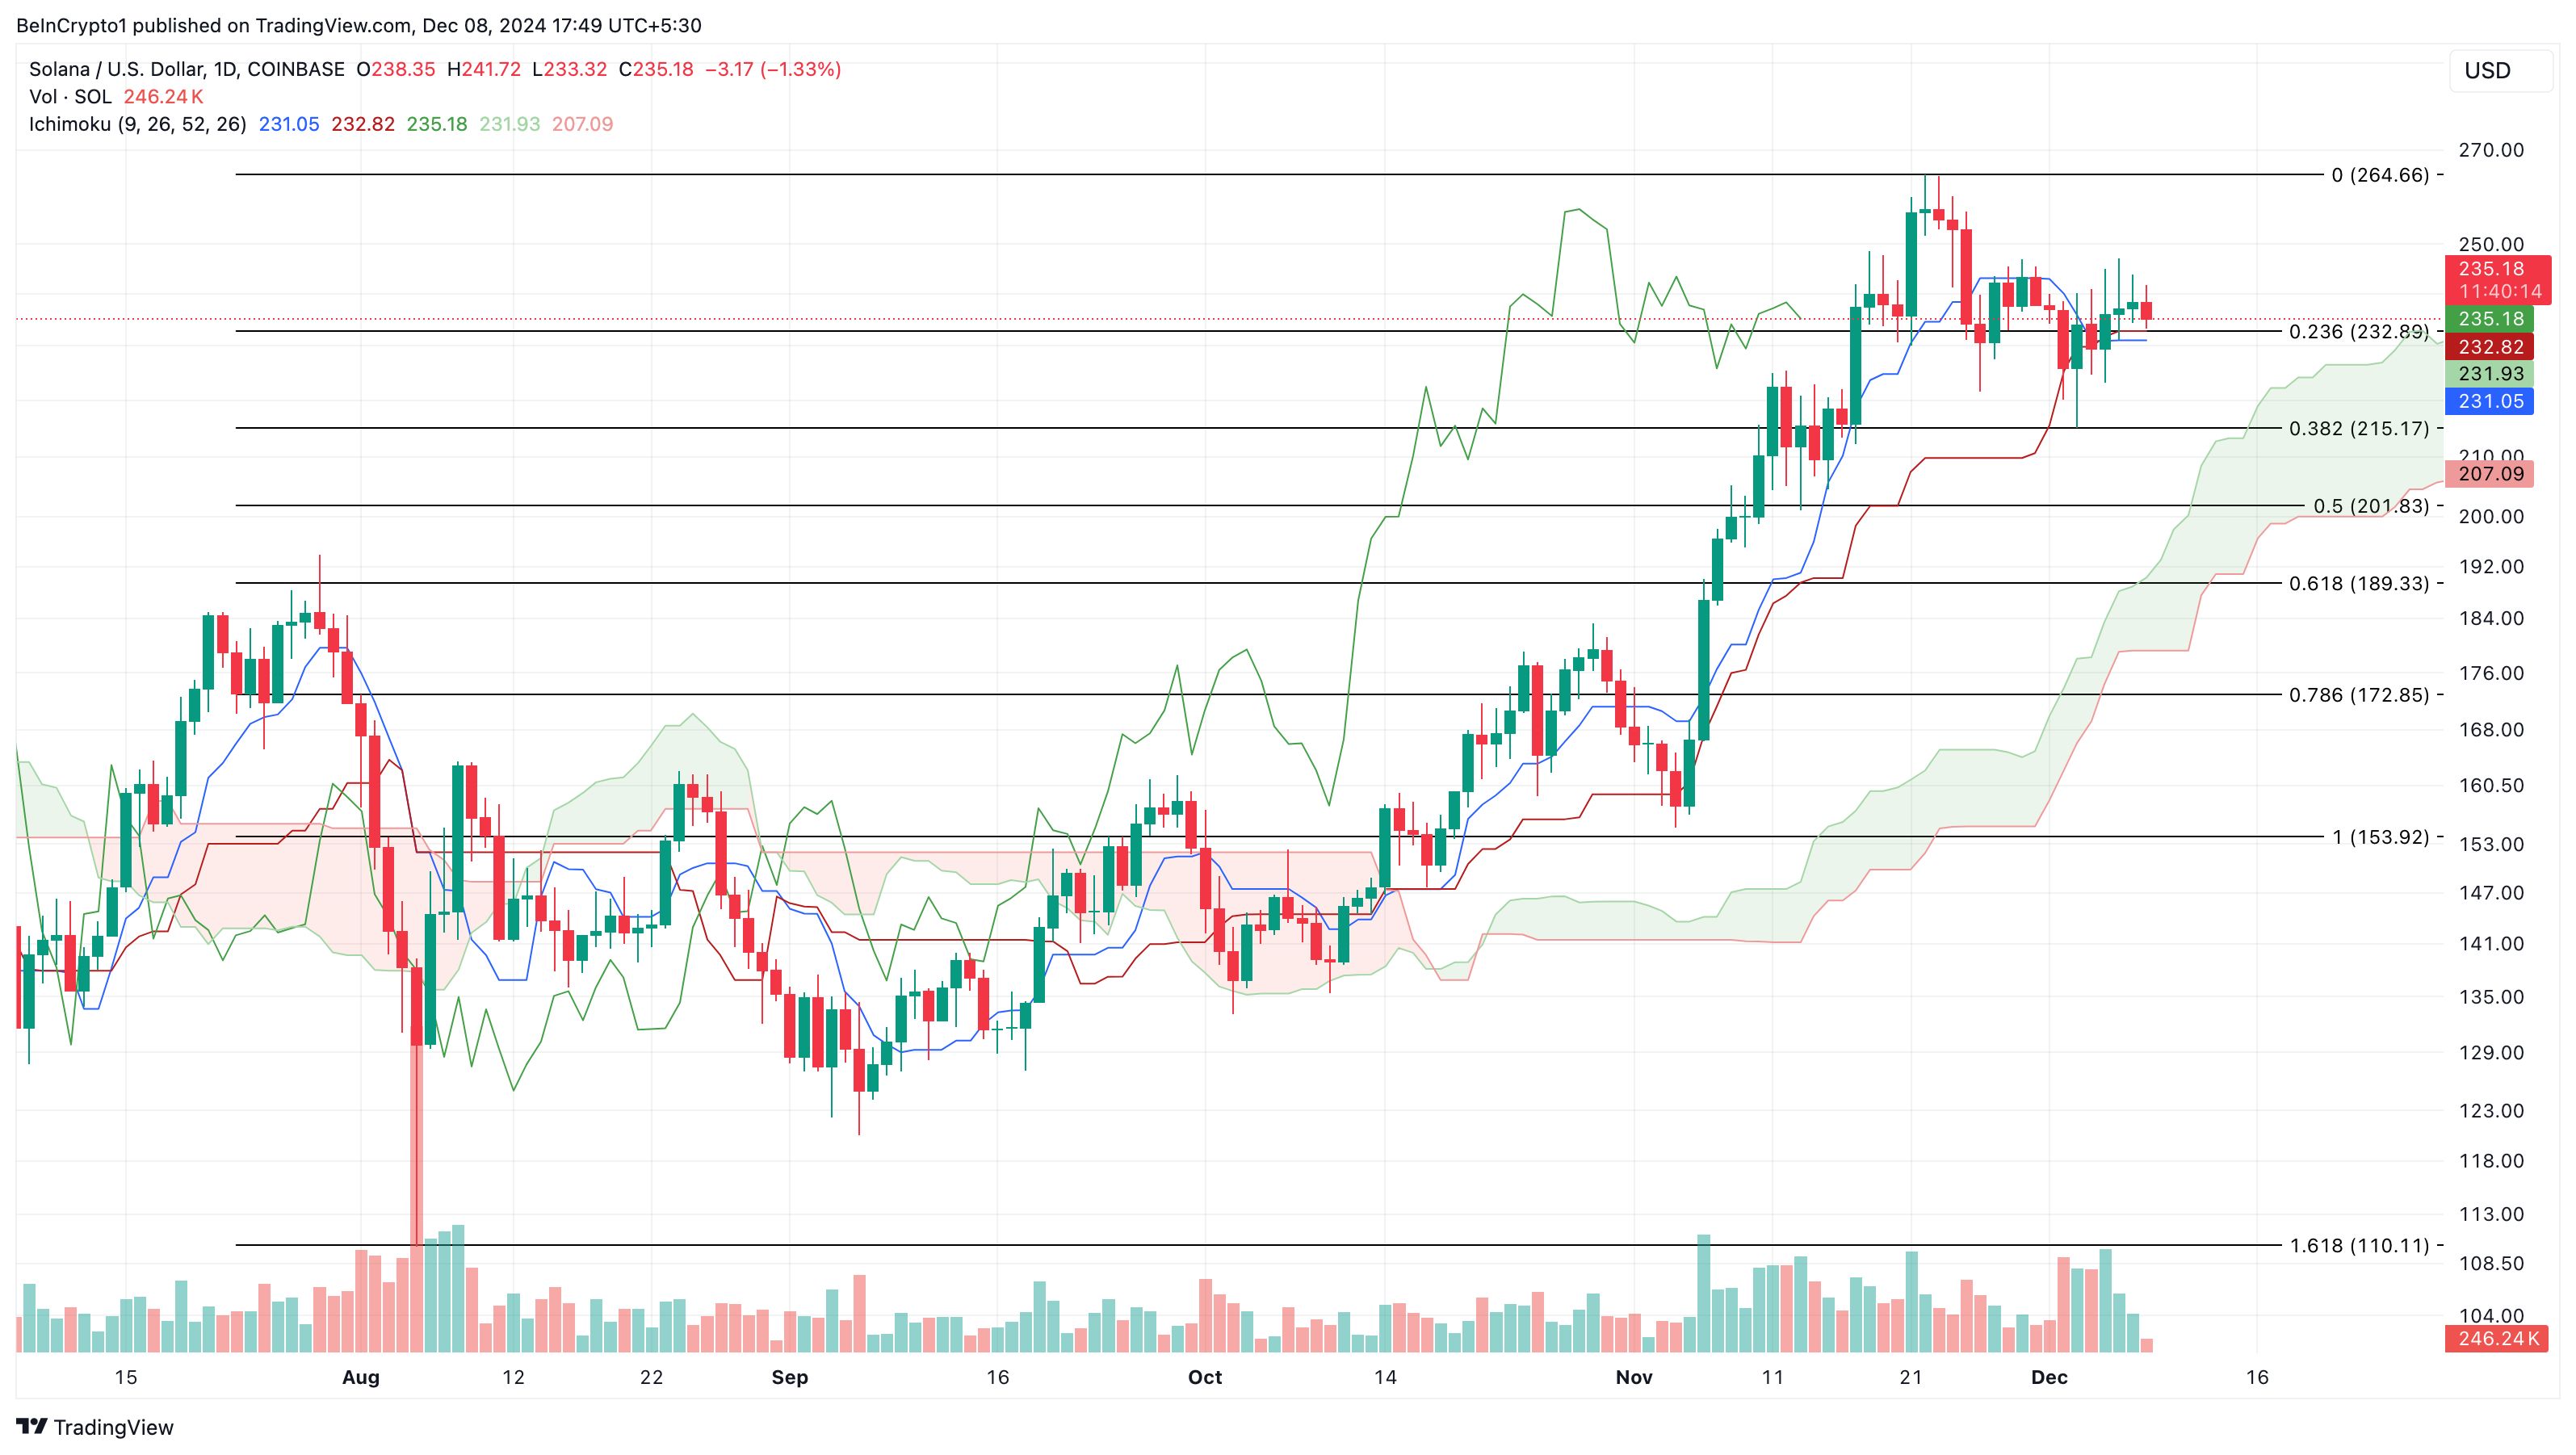 Solana Daily Analysis. Source:
TradingView
Solana Daily Analysis. Source:
TradingView
If sustained, then SOL might rise above the all-time high and climb to $300.On the other hand, if it encounters resistance on the Solana weekly and daily chart, the price could drop to $215.17.
Disclaimer: The content of this article solely reflects the author's opinion and does not represent the platform in any capacity. This article is not intended to serve as a reference for making investment decisions.
You may also like
Aster announces a $10 million trading competition, combined with Stage 4 airdrop and Rocket Launch incentives, driving multi-layered growth in platform depth and liquidity.
After achieving strong performance in Stage 3, Stage 4 (Harvest) airdrop plan was launched, and the “Double Harvest” trading competition with a total reward of 10 million USD will be introduced on November 17.

Mars Morning News | Federal Reserve officials send strong hawkish signals again, December rate cut in doubt
The crypto market has generally declined, with bitcoin and ethereum prices falling and altcoins experiencing significant drops. Hawkish signals from the Federal Reserve have affected market sentiment, and multiple project tokens are about to be unlocked. Early ethereum investors have made substantial profits, and expectations for a continued gold bull market persist. Summary generated by Mars AI. The accuracy and completeness of this summary, generated by the Mars AI model, are still being iteratively improved.

IOTA collaborates on the ADAPT project: Building the future of digital trade in Africa together
IOTA is collaborating with the World Economic Forum and the Tony Blair Institute for Global Change on the ADAPT project. ADAPT is a pan-African digital trade initiative led by the African Continental Free Trade Area. Through digital public infrastructure, ADAPT connects identity, data, and finance to enable trusted, efficient, and inclusive trade across Africa.