Solana (SOL) Bulls Stay in Control: Rally Far From Over?

Solana started a fresh increase above the $240 zone. SOL price is consolidating gains and might aim for an upside break above the $255 resistance.
- SOL price started a fresh increase after it settled above the $220 level against the US Dollar.
- The price is now trading below $255 and the 100-hourly simple moving average.
- There is a short-term bearish trend line forming with resistance at $252 on the hourly chart of the SOL/USD pair (data source from Kraken).
- The pair could start a fresh increase if the bulls clear the $255 zone.
Solana Price Eyes More Upsides
Solana price formed a support base and started a fresh increase above the $232 level beating Bitcoin and Ethereum . There was a strong move above the $245 and $250 resistance levels.
The price even cleared the $260 level. A high was formed at $2648 and the price is now consolidating gains. There was a move below the $260 and $255 levels. The price dipped below the 50% Fib retracement level of the upward move from the $230 swing low to the $264 high.
However, the bulls are active near the $242 support and the 61.8% Fib retracement level of the upward move from the $230 swing low to the $264 high. Solana is now trading below $255 and the 100-hourly simple moving average.
On the upside, the price is facing resistance near the $252 level. There is also a short-term bearish trend line forming with resistance at $252 on the hourly chart of the SOL/USD pair.
Source: SOLUSD on TradingView.comThe next major resistance is near the $255 level. The main resistance could be $265. A successful close above the $265 resistance level could set the pace for another steady increase. The next key resistance is $275. Any more gains might send the price toward the $282 level.
Are Dips Limited in SOL?
If SOL fails to rise above the $255 resistance, it could start a downside correction. Initial support on the downside is near the $246 level. The first major support is near the $242 level.
A break below the $242 level might send the price toward the $238 zone. If there is a close below the $238 support, the price could decline toward the $230 support in the near term.
Technical Indicators
Hourly MACD – The MACD for SOL/USD is gaining pace in the bullish zone.
Hourly Hours RSI (Relative Strength Index) – The RSI for SOL/USD is above the 50 level.
Major Support Levels – $246 and $242.
Major Resistance Levels – $255 and $260.
Disclaimer: The content of this article solely reflects the author's opinion and does not represent the platform in any capacity. This article is not intended to serve as a reference for making investment decisions.
You may also like
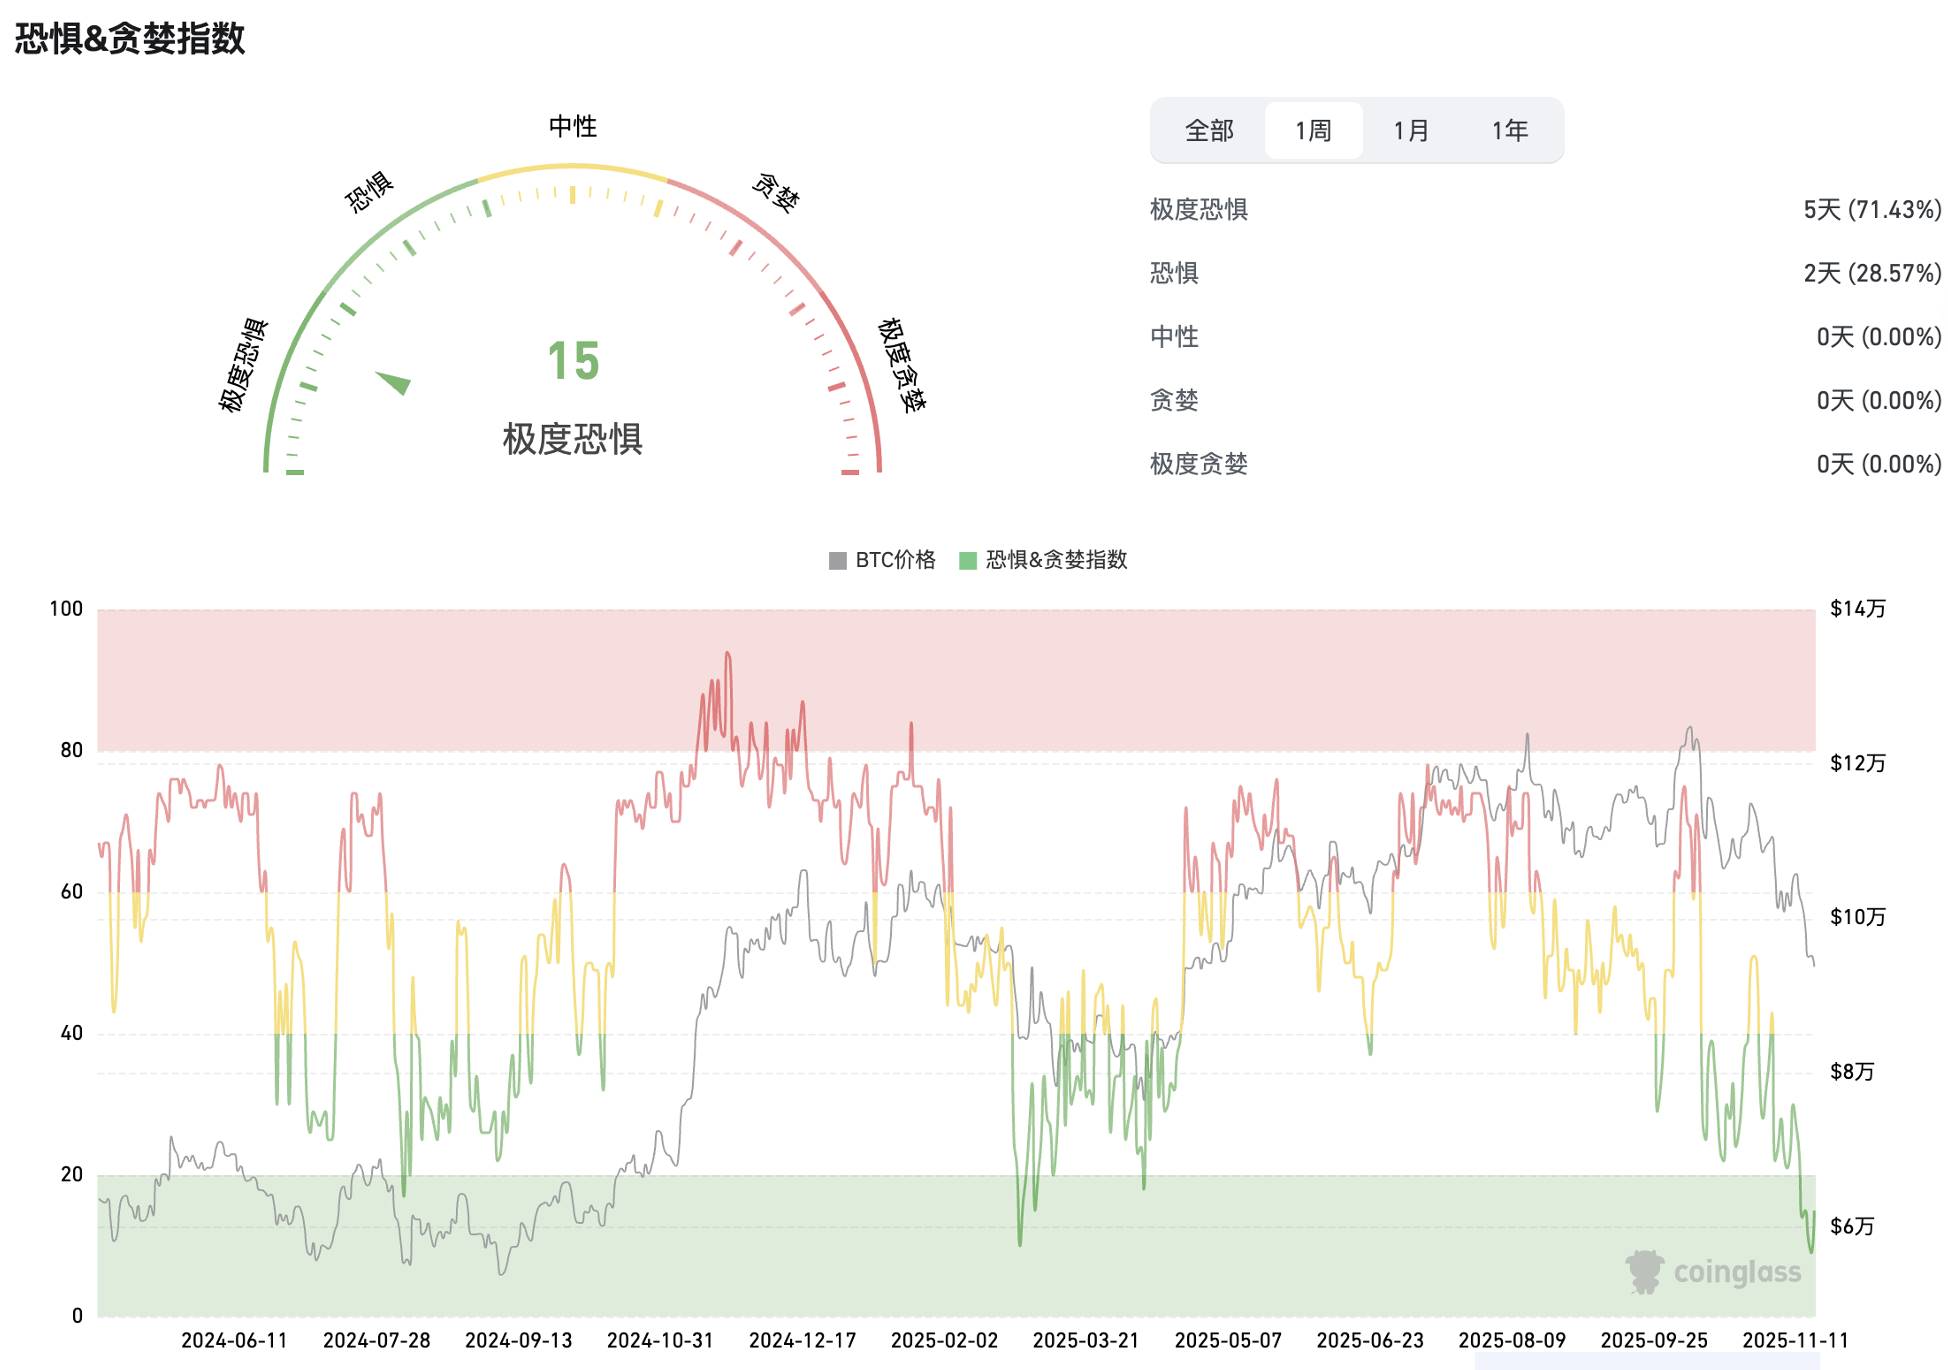
Weekly Crypto Market Watch (11.10-11.17): Extreme Market Panic, Privacy Sector Stands Out
Last week, both the open interest and trading volume of altcoin contracts on exchanges declined, reflecting a continued lack of liquidity following the sharp drop on October 11.
Multiple grand rewards are coming, TRON ecosystem Thanksgiving feast begins
Five major projects within the TRON ecosystem will jointly launch a Thanksgiving event, offering a feast of both rewards and experiences to the community through trading competitions, community support activities, and staking rewards.

Yala Faces Turmoil as Stability Falters Dramatically
In Brief Yala experienced a dramatic 52.9% decline, challenging its stability. Liquidity management emerged as a critical vulnerability in stablecoins. Investor skepticism deepened despite major fund support.