Bitget App
Trade smarter
Buy cryptoMarketsTradeFuturesEarnWeb3SquareMore
Trade
Spot
Buy and sell crypto with ease
Margin
Amplify your capital and maximize fund efficiency
Onchain
Going Onchain, without going Onchain!
Convert & block trade
Convert crypto with one click and zero fees
Explore
Launchhub
Gain the edge early and start winning
Copy
Copy elite trader with one click
Bots
Simple, fast, and reliable AI trading bot
Trade
USDT-M Futures
Futures settled in USDT
USDC-M Futures
Futures settled in USDC
Coin-M Futures
Futures settled in cryptocurrencies
Explore
Futures guide
A beginner-to-advanced journey in futures trading
Futures promotions
Generous rewards await
Overview
A variety of products to grow your assets
Simple Earn
Deposit and withdraw anytime to earn flexible returns with zero risk
On-chain Earn
Earn profits daily without risking principal
Structured Earn
Robust financial innovation to navigate market swings
VIP and Wealth Management
Premium services for smart wealth management
Loans
Flexible borrowing with high fund security
Is the Worst Over for DOT or More Pain to Come? (Polkadot Price Analysis)

Is the Worst Over for DOT or More Pain to Come? (Polkadot Price Analysis)

CryptopotatoCryptopotato2024/06/14 15:50
By:Author: CryptoVizArt

Polkadot’s price has been consolidating sideways near the critical resistance region around the $6.5 threshold. A slight bullish reversal might occur in the short term due to the potential heightened demand near this pivotal level.

Technical Analysis

By Shayan

The Daily Chart

The daily chart shows Polkadot’s bearish momentum faded after reaching the substantial support region of $6.5, an important level in recent months. This pivotal support is accompanied by substantial demand, which could potentially overcome the ongoing supply.

However, the price is trapped within a critical and decisive range, bounded by the $6.5 support and a multi-month dynamic descending trendline. As the range narrows, an imminent breakout will likely determine the price’s next move in the short term.

The 4-Hour Chart

On the 4-hour chart, Polkadot experienced a substantial increase in demand near the crucial $6.2 mark, leading to an impulsive surge toward the short-term local resistance of $6.8.

However, the price then faced selling pressure, resulting in a retrace. The $6.8 local resistance serves as the last supply zone before the initial breakout of the wedge pattern, and the recent rejection from this level indicates a valid pullback to the broken level, highlighting the ongoing bearish sentiment in the market.

Despite this, the price appears confined to $6.2 support and $6.8 resistance. A breakout from this range will likely clarify the upcoming price direction.

Sentiment Analysis

By Shayan

Polkadot’s price is currently fluctuating around the $6.5 level, and the Binance liquidation heatmap provides insights into this behavior. This price region appears to be filled with demand, having supported the price multiple times.

The heatmap reveals significant buy-stop orders and liquidity above the $7.3 mark. This makes it a potential target for buyers, especially if there is a bullish revival in the coming days.

Should the price reach this crucial range, it would likely act as a resistance, resulting in a struggle between buyers and sellers. This scenario could lead to heightened volatility and increased market activity.

0

Disclaimer: The content of this article solely reflects the author's opinion and does not represent the platform in any capacity. This article is not intended to serve as a reference for making investment decisions.

PoolX: Earn new token airdrops
Lock your assets and earn 10%+ APR
Lock now!

You may also like

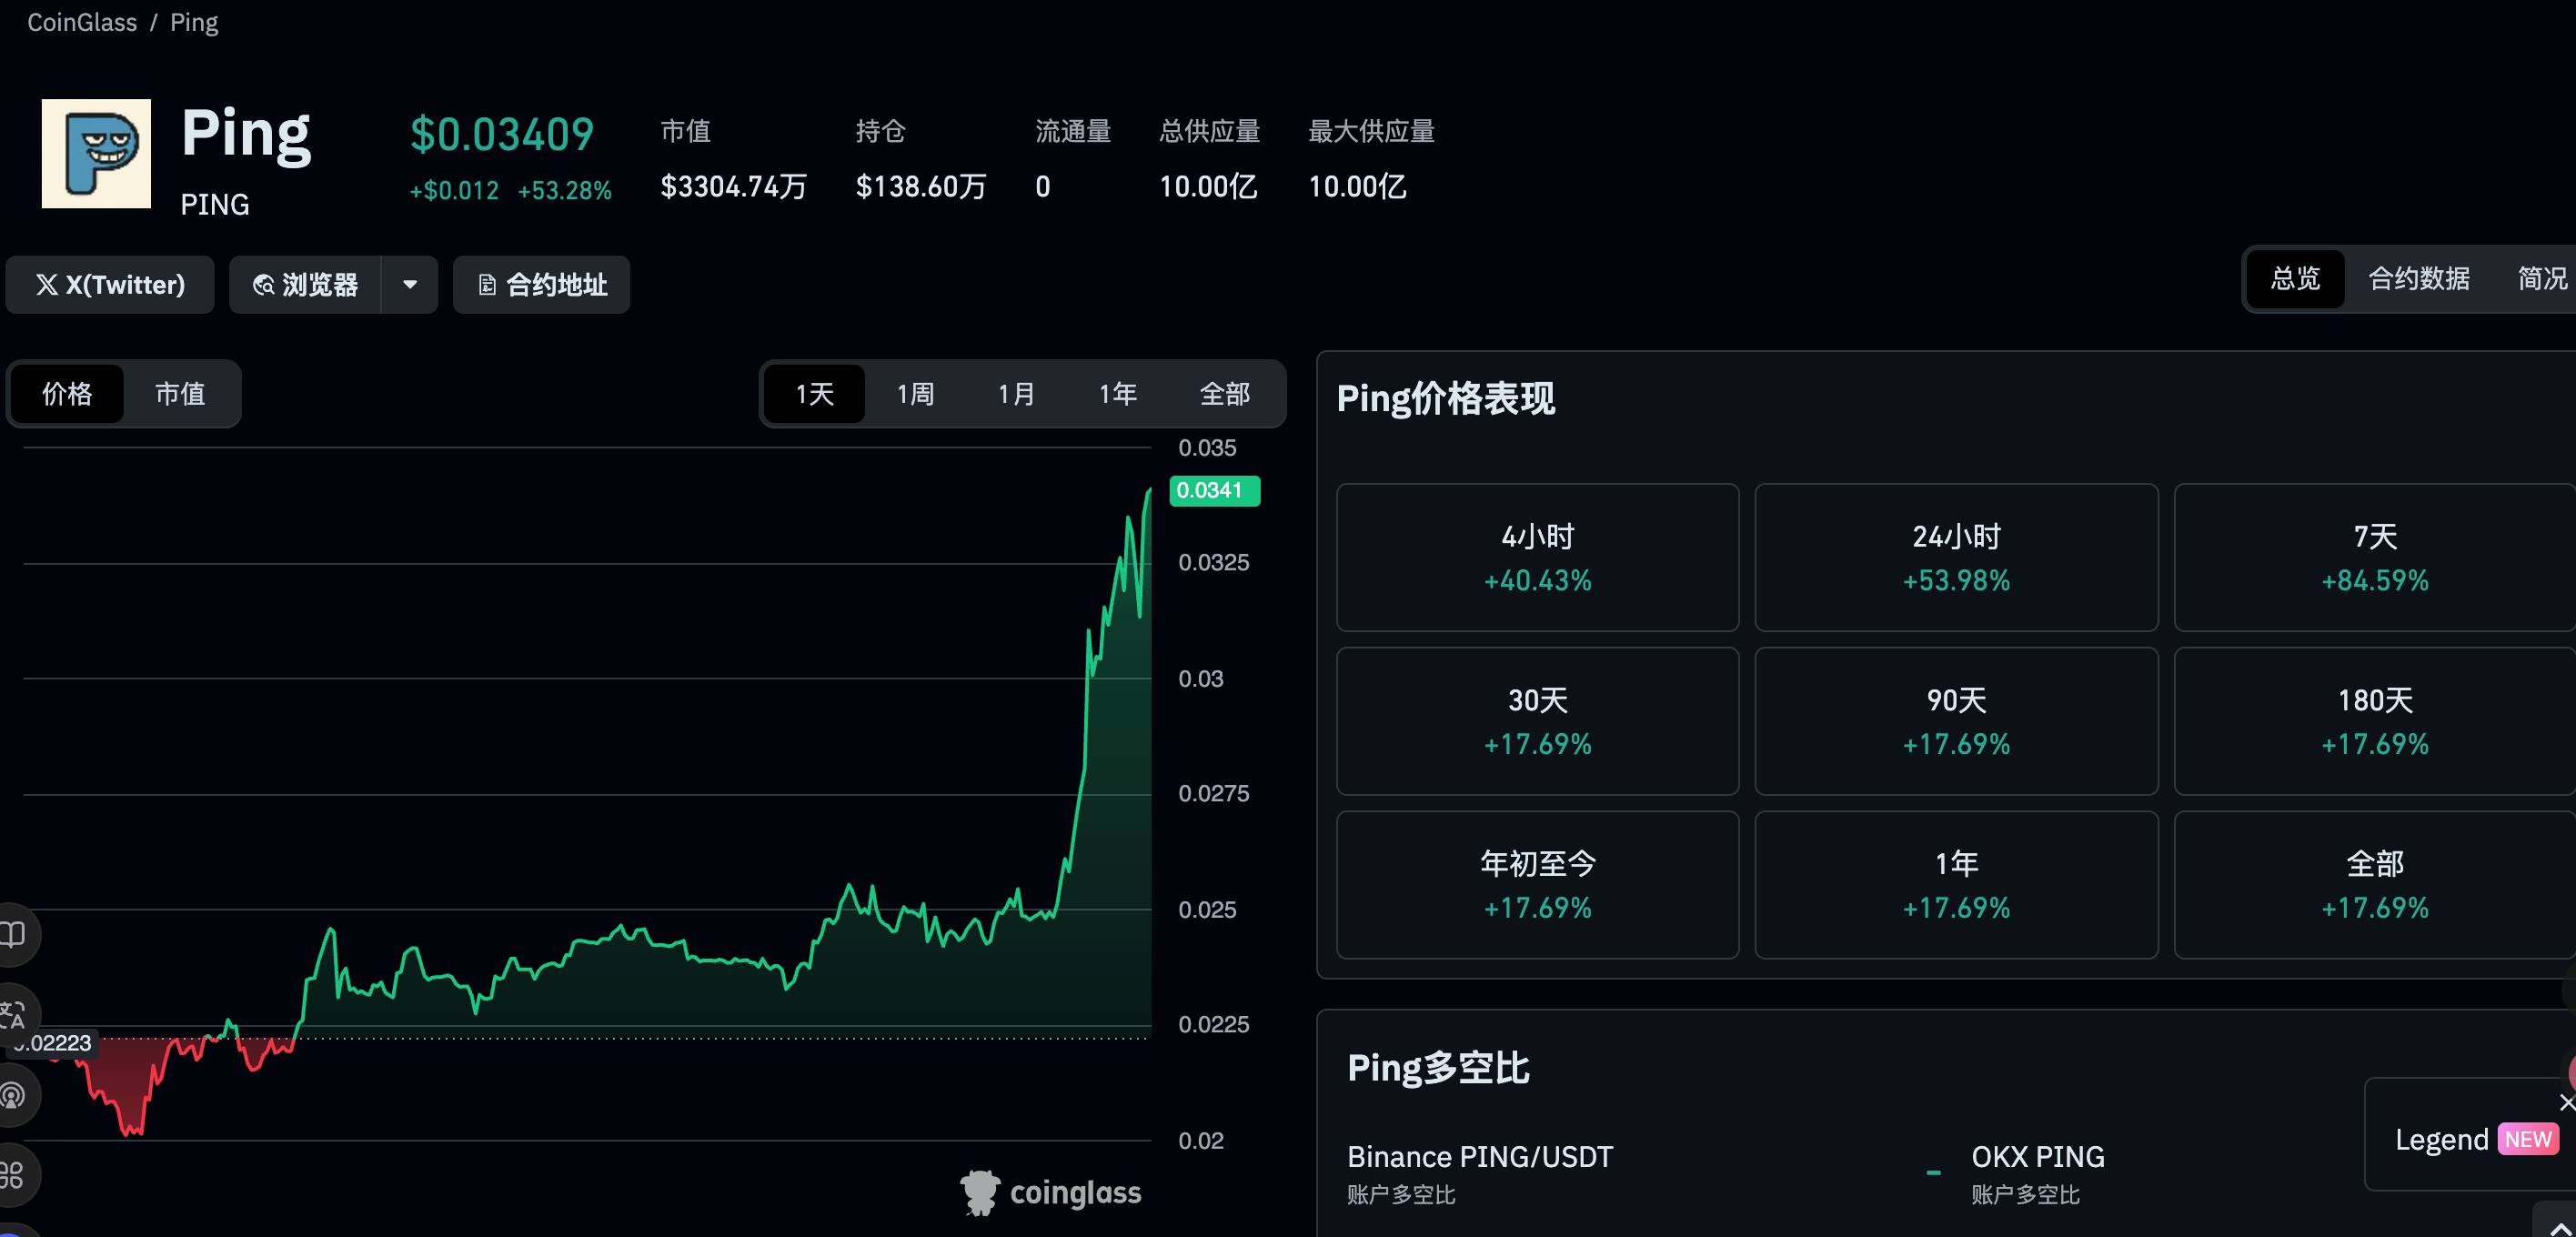
$PING rebounds 50%, a quick look at the $PING-based launchpad project c402.market

c402.market's mechanism design is more inclined to incentivize token creators, rather than just benefiting minters and traders.

深潮2025/11/10 19:13
$PING rebounds 50%, a quick look at the $PING-based launchpad project c402.market

Crypto Capitalism, Crypto in the AI Era

A one-person media company, ushering in the era of everyone as a Founder.

深潮2025/11/10 19:12
Crypto Capitalism, Crypto in the AI Era

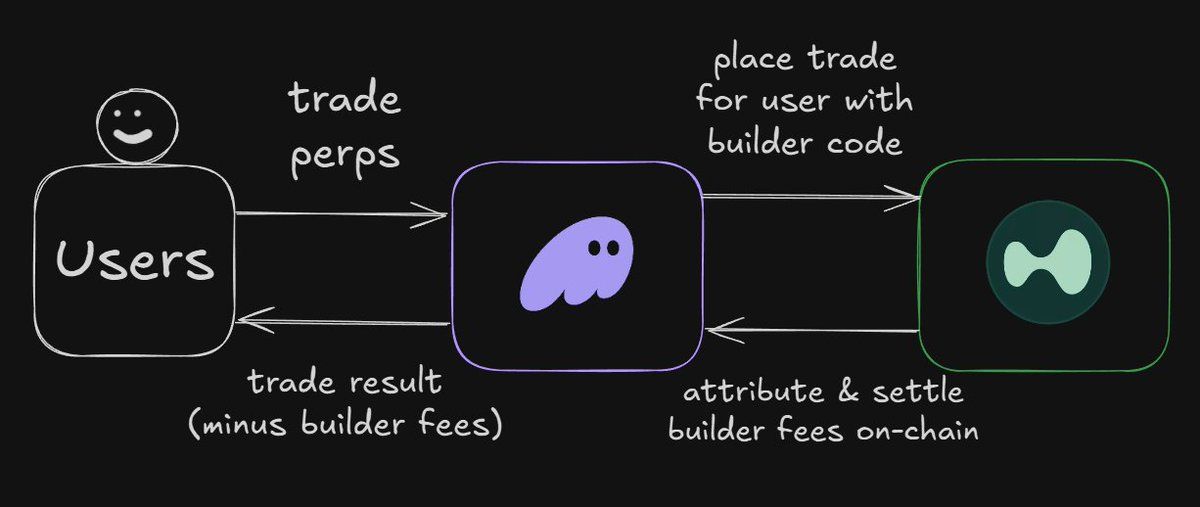
Interpretation of the ERC-8021 Proposal: Will Ethereum Replicate Hyperliquid’s Developer Wealth Creation Myth?

The platform serves as a foundation, enabling thousands of applications to be built and profit.

深潮2025/11/10 19:12
Interpretation of the ERC-8021 Proposal: Will Ethereum Replicate Hyperliquid’s Developer Wealth Creation Myth?

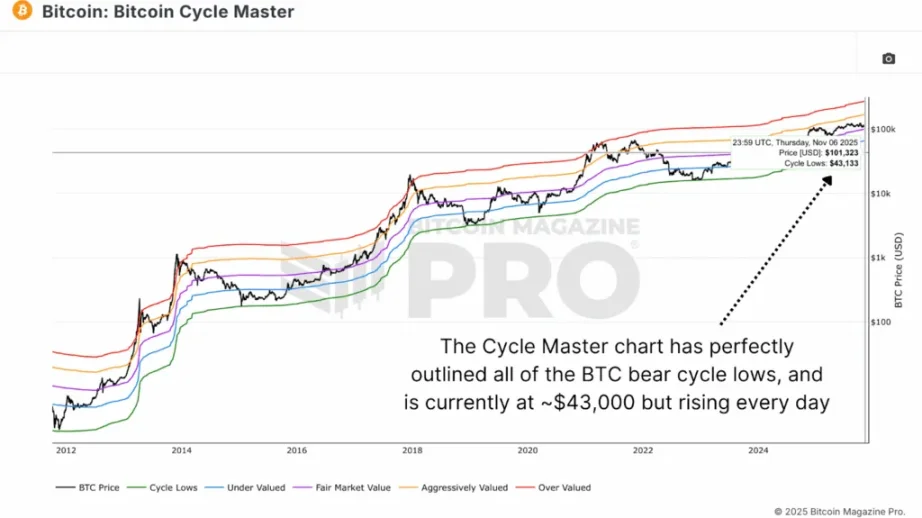
Data shows that the bear market bottom will form in the $55,000–$70,000 range.

If the price falls back to the $55,000-$70,000 range, it would be a normal cyclical movement rather than a signal of systemic collapse.

深潮2025/11/10 19:12
Data shows that the bear market bottom will form in the $55,000–$70,000 range.