3 signs that Ethereum price will finally break $4K in June

Ethereum's native token, Ether , has rallied by circa 67% so far in 2024 and may continue its upside moves in June, per a mix of on-chain, fundamental, and technical indicators.
Falling wedge breakout has ETH price eyeing $4K
As of June 1, Ether had entered the breakout stage of its prevailing falling wedge pattern .
A falling wedge is a bullish reversal pattern characterized by two descending, converging trendlines. As a rule of technical analysis, this pattern resolves when the price breaks above the upper trendline and rises by as much as the wedge's maximum height.
On May 20, ETH's price broken above the wedge's upper trendline with a rise in trading volumes, confirming its bias to reach the pattern's upside target at around $4,255 by June's end, up 12.65% from the current price levels.
 ETH/USD daily price chart. Source:
TradingView
ETH/USD daily price chart. Source:
TradingView
Interestingly, the ongoing breakout further appears to be part of a bull flag pattern, characterized by two parallel, downward-sloping trendlines.
 ETH/USD daily price chart. Source: TradingView
As a rule of technical analysis, bull flags resolve when the price breaks above their upper trendline and rises by as much as the previous uptrend's height. This puts ETH en route $6,000 by June's end or early July.
Ethereum's richest whales accumulates ETH
Ether's potential to reach $4,000 receive further boost from its richest whale cohort.
According to on-chain data resource Santiment, the Ether supply held by entities with a balance of 10 million—100 million ETH (black) has increased by circa 0.5% since May 20, when rumors about the U.S. Securities and Exchange Commission's (SEC) reconsideration toward spot Ether ETF denials started.
 Ether supply distribution among whales. Source: Santiment
The accumulation coincided with a 19.25% ETH/USD price boom. It kept growing after spot Ether ETFs received official approval from the SEC on May 23.
Conversely, the Ether supply held by entities with a 1 million—10 million ETH balance (brown) declined sharply during the ETH's price rally, suggesting profit-taking. But, at the same time, the Ether reserves across all the crypto exchanges has declined sharply recently.
 Ethereum exchange reserves. Source: CryptoQuant
This shows that most investors are withdrawing their ETH holdings from crypto exchanges—a sign of increasing hodling sentiment, which increases Ether's potential to continue rallying in June above $4,000.
SEC may approve spot Ether ETFs in June
According to analysts, there is a "legit possibility" that U.S. spot Ether (ETH) exchange-traded funds (ETFs) could launch by late June following BlackRock's decision to update the Form S-1 for its iShares Ethereum Trust (ETHA) with the SEC.
"This is a good sign. We’ll probably see the rest roll in soon," Bloomberg ETF analyst Eric Balchunas commented in a May 29 post on X. Earlier, Balchunas had predicted spot Ether ETFs to take in 10-15% of the flows that spot Bitcoin ETFs have seen in the earlier days after their launch.
Spot Bitcoin ETFs have seen a net inflow of $13.85 billion since their launch in January.
 Spot
Bitcoin ETF cumulative inflows. Source: Farside Investors
Spot
Bitcoin ETF cumulative inflows. Source: Farside Investors
The successful launch of Ether ETFs in June, accompanied by significant capital inflows, suggests there is rising demand for ETH. These factors can push Ether's price above $4,000 over the next 30 days.
Disclaimer: The content of this article solely reflects the author's opinion and does not represent the platform in any capacity. This article is not intended to serve as a reference for making investment decisions.
You may also like
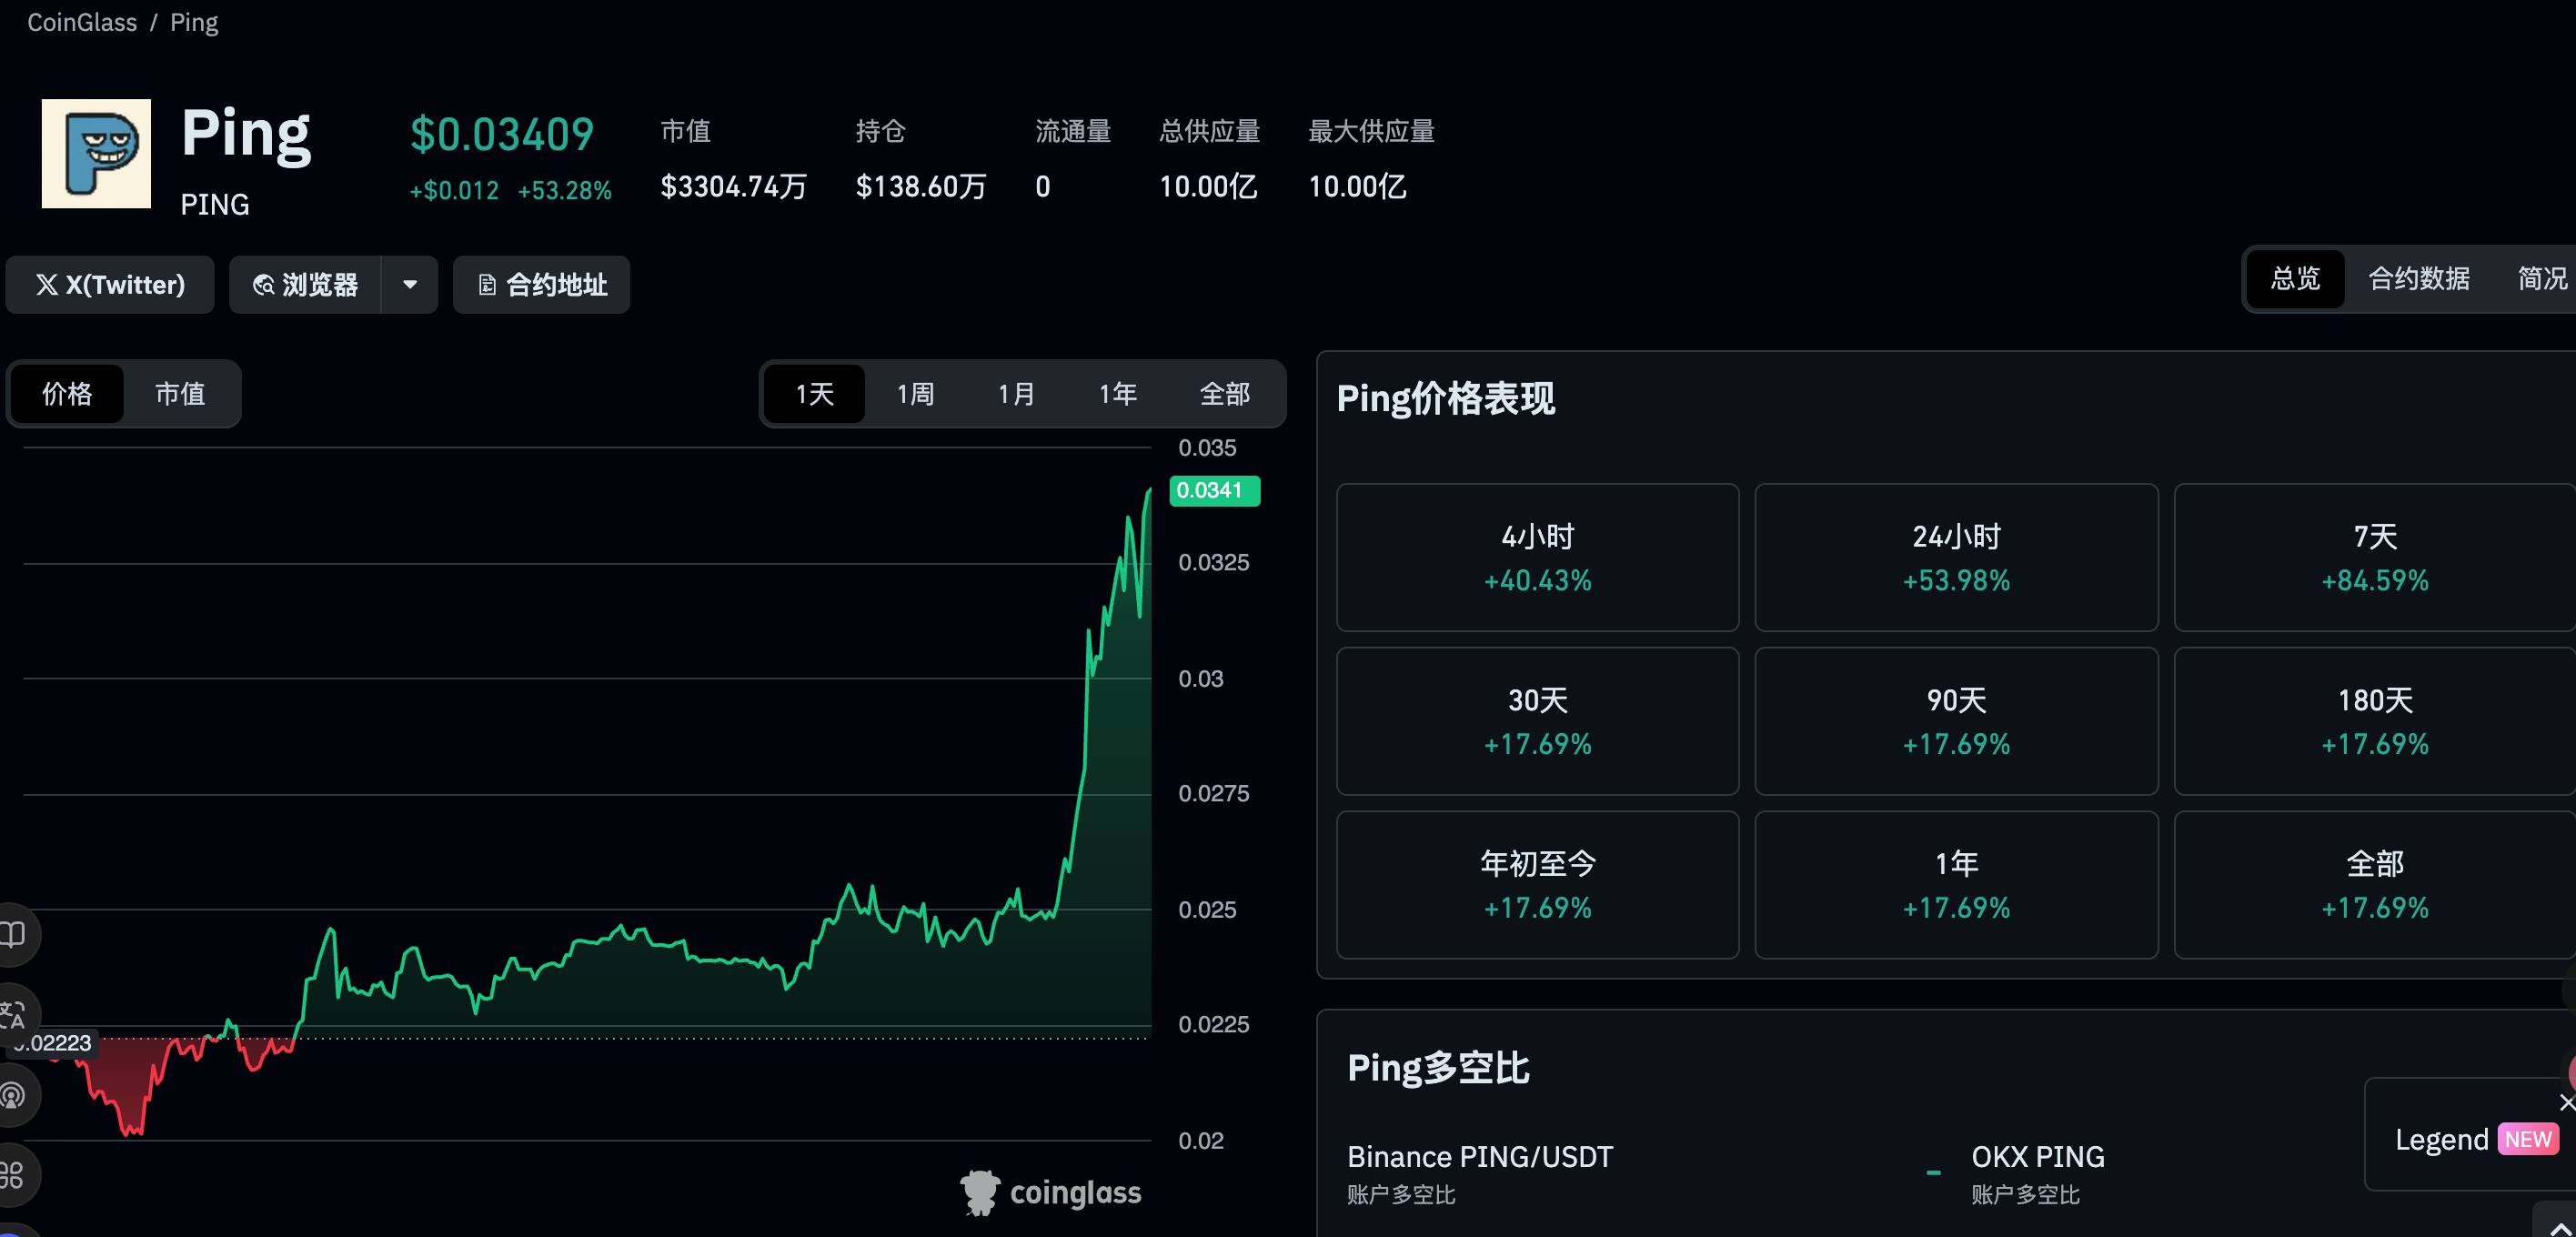
$PING rebounds 50%, a quick look at the $PING-based launchpad project c402.market
c402.market's mechanism design is more inclined to incentivize token creators, rather than just benefiting minters and traders.
Crypto Capitalism, Crypto in the AI Era
A one-person media company, ushering in the era of everyone as a Founder.

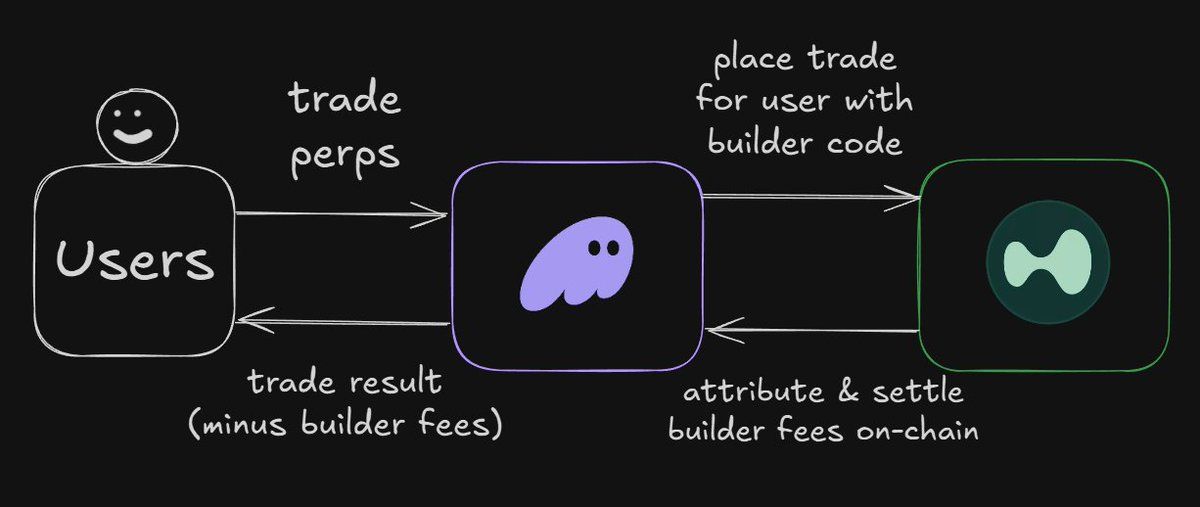
Interpretation of the ERC-8021 Proposal: Will Ethereum Replicate Hyperliquid’s Developer Wealth Creation Myth?
The platform serves as a foundation, enabling thousands of applications to be built and profit.
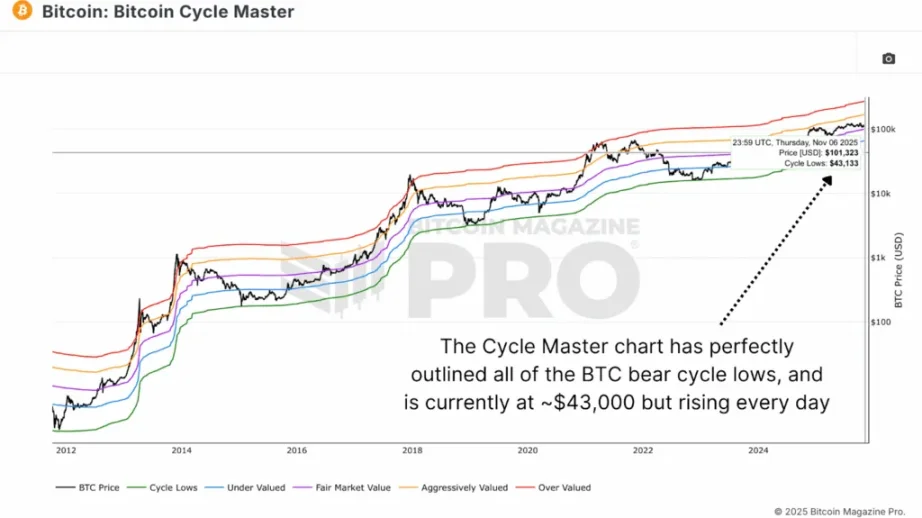
Data shows that the bear market bottom will form in the $55,000–$70,000 range.
If the price falls back to the $55,000-$70,000 range, it would be a normal cyclical movement rather than a signal of systemic collapse.