BTC Needs to Break This Level to Aim for a New All-Time High (Bitcoin Price Analysis)

Bitcoin’s price is currently consolidating below the $70K level, failing to continue its rally and make a higher all-time high. Yet, investors remain optimistic as no worrying signs are surfacing yet.
Technical Analysis
By TradingRage
The Daily Chart
On the daily chart, the price has been hovering around the $70K mark and is yet to show a prolonged movement to either side.
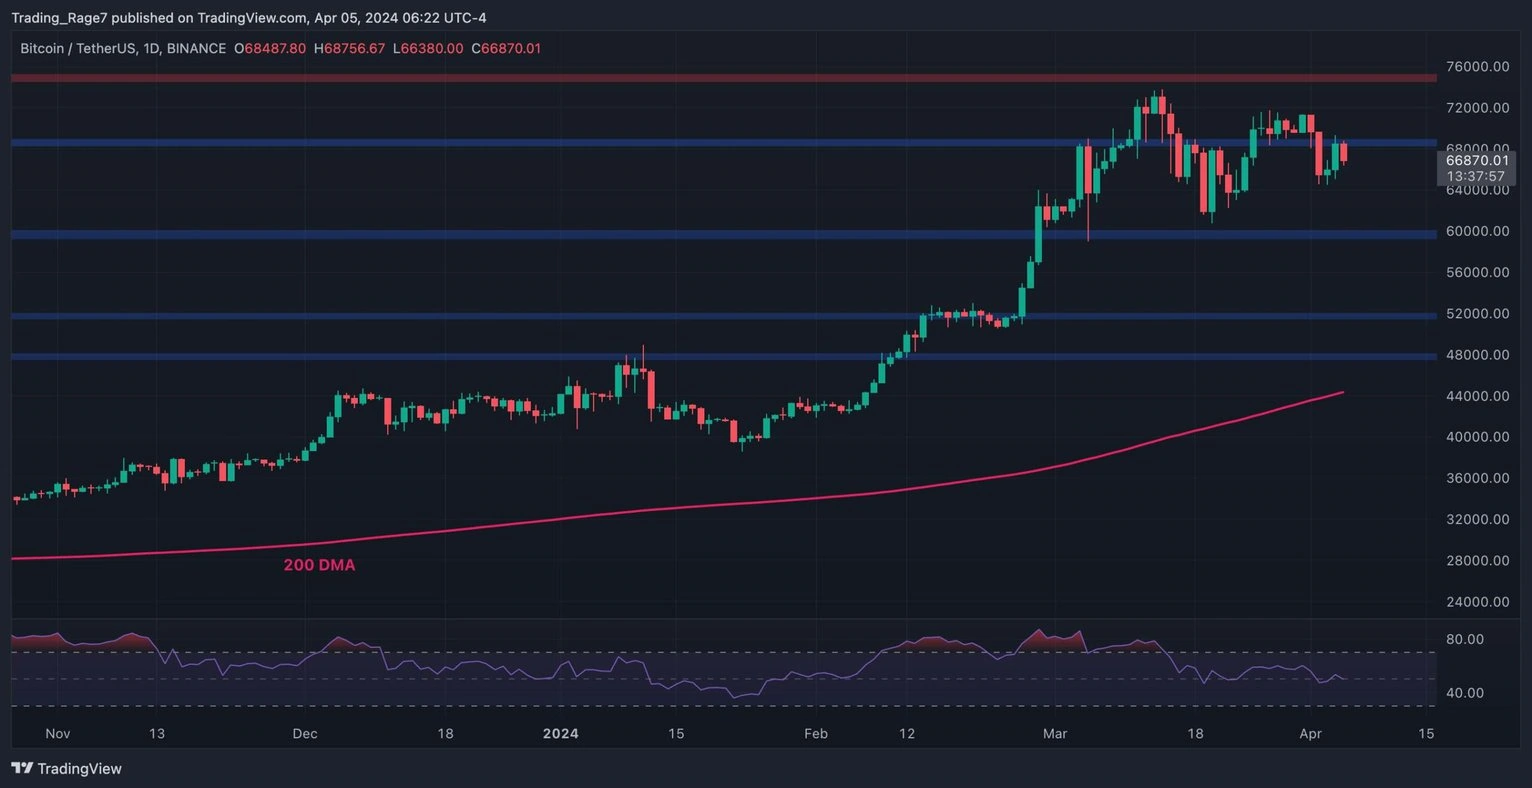
The $68K resistance level is currently being tested, but the price has not been able to break it to the upside. In case a bullish breakout finally occurs, the market seems likely to set a new all-time high and attack the $80K region. On the other hand, a definitive rejection would result in a deeper decline toward the $60K support zone.
The 4-Hour Chart
Looking at the 4-hour chart, the market has created new short-term support around the $64K mark after rebounding from the level last week. Yet, the $68K has held the price, preventing a run toward $70K and beyond.
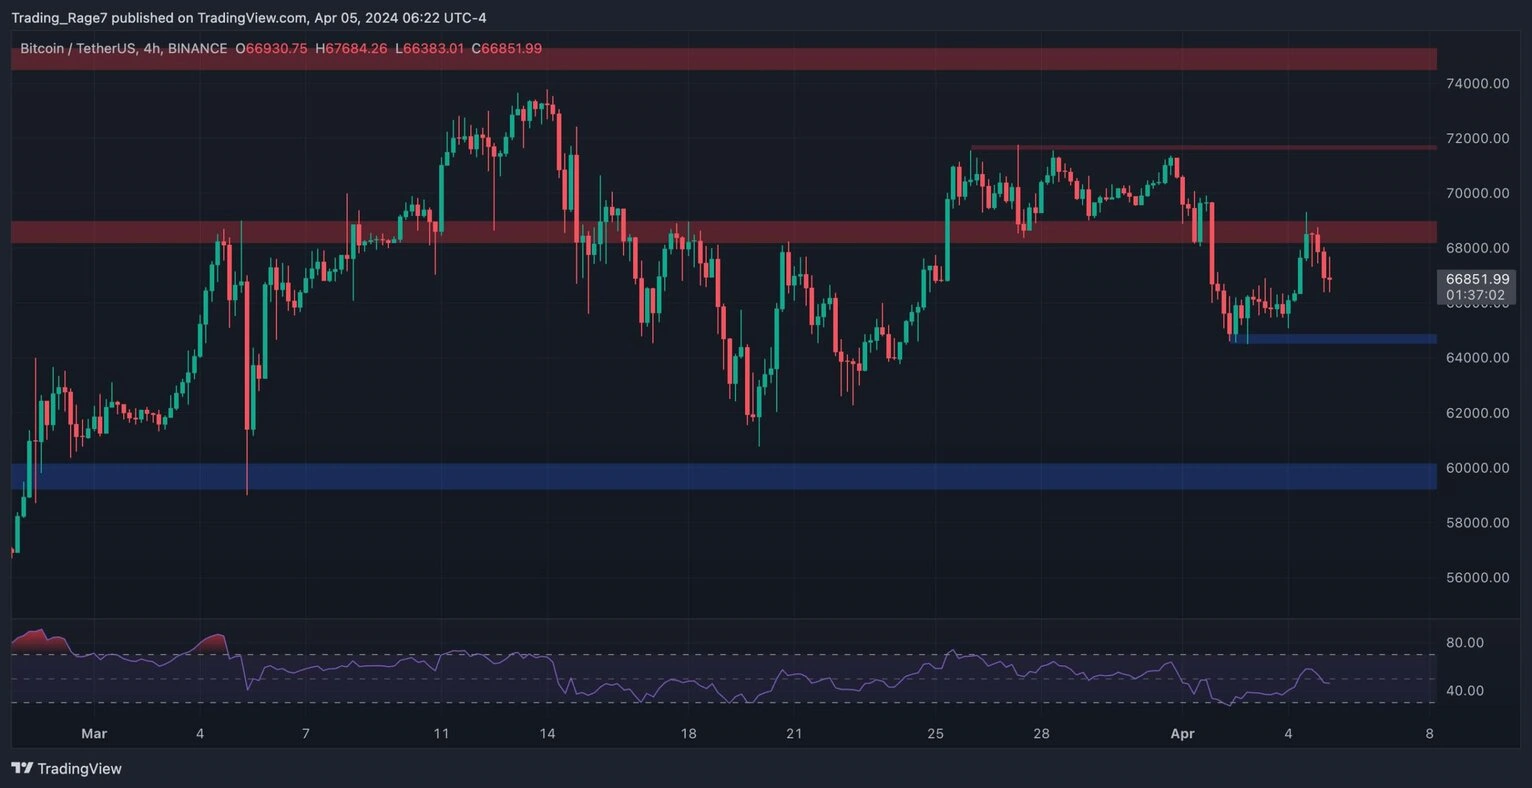
The short-term fate of the market hangs in the balance at the moment, as a breakout to either side could result in a larger move.
The Relative Strength Index is also oscillating around the 50% level, indicating that the momentum is neutral and neither a bullish nor a bearish move is more probable.
On-Chain Analysis
By TradingRage
Binance BTC/USDT Liquidation Heatmap
There is no denying the deep influence of the perpetual futures market on Bitcoin’s price action. Most short-term price moves, especially those after periods of consolidation, are caused by liquidations in the futures market. Therefore, painting a picture of where the most liquidity potentially resides can be very helpful.
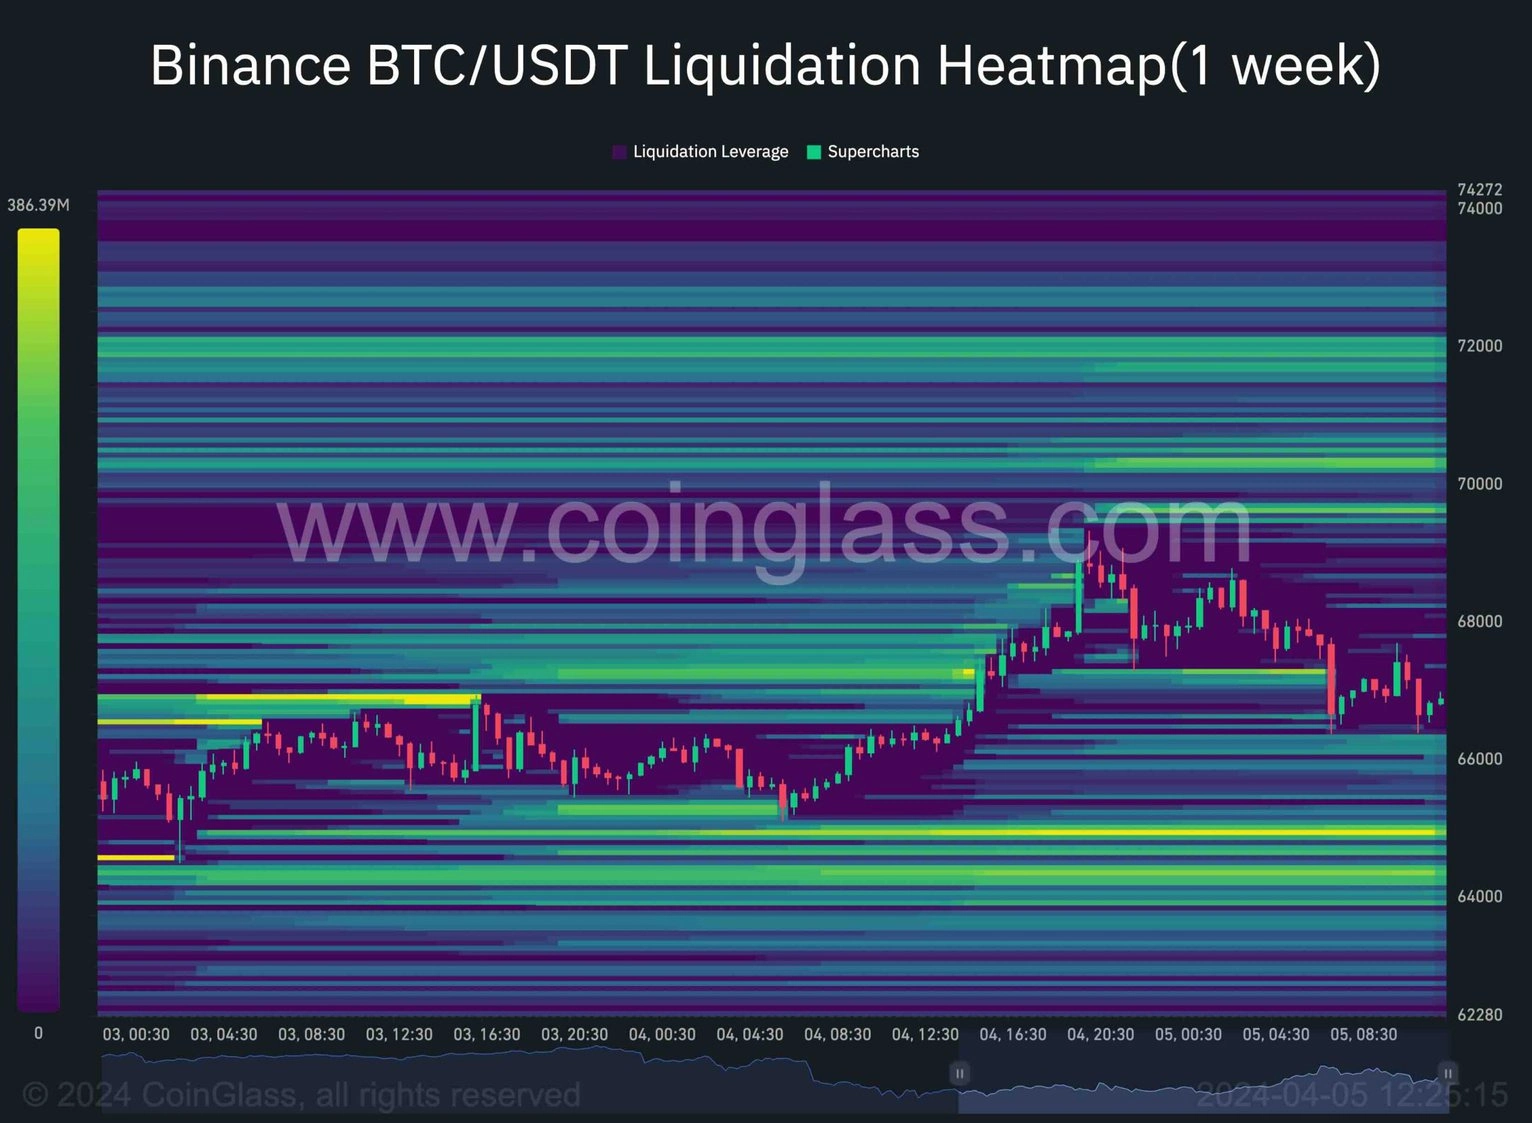
This chart represents the Binance BTC/USDT heatmap. It predicts the price levels at which large-scale liquidation events may occur. So, when Bitcoin reaches areas with yellow color, a liquidation cascade is likely to materialize.
As the chart depicts, the $64K-$65K zone is filled with massive liquidity, and if the price reaches these levels, a large liquidation cascade could happen that would result in a rapid drop toward the $60K level.
Similarly, if the market climbs toward the $70K level, it is likely to surge rapidly as a result of a short liquidation cascade, and a new all-time high would be highly probable. These levels can be used as reference points in the short term and could determine the market trend in the coming weeks.
Disclaimer: The content of this article solely reflects the author's opinion and does not represent the platform in any capacity. This article is not intended to serve as a reference for making investment decisions.
You may also like
"Whales" Accelerate Bitcoin Sell-Off, But Is It Really a Panic Signal?
Some "whale" wallets are showing regular selling patterns, which may be related to profit-taking rather than panic signals, but the market's ability to absorb these sales has weakened.

Will bitcoin be cracked by quantum computers by 2030?
Quantum computers may break bitcoin within five years. How will the crypto world respond to this existential crisis?

Raking in crypto dividends: How did the family of Trump's Secretary of Commerce earn 2.5 billions dollars a year?
After Howard Lutnick became the Secretary of Commerce in the Trump administration, his family's investment bank, Cantor, is heading toward its most profitable year ever.

BTC price bull market lost? 5 things to know in Bitcoin this week